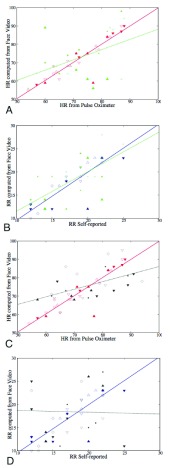
FIGURE 7.
Scatter plots comparing accuracy of HR and RR obtained from a iPPG using a face video, with standard approaches for measuring HR (Panel A and C) and RR (Panel B and D). Panel A shows results for HR computed using two iPPGs obtained from a single video with flash on (a) Hue (0–0.1) (Red Full) and (b) Green channel (Green Dashed), compared with HR measured using pulse oximetry. Panel B shows results for RR computed using two iPPG obtained from a single video with flash on (a) Hue (0–0.1) (Blue Full) and (b) Green channel (Green Dashed), compared with RR measured using self reporting. Panel C shows results for HR computed using two iPPG obtained from two separate videos (a) Hue (0–0.1) with flash on (Red Full) and (b) Hue (0–0.1) with flash off (Grey Dashed), compared with HR measured using pulse oximetry. Panel D shows results for RR computed using (a) Hue (0–0.1) with flash on (Blue Full) and (b) Hue (0–0.1) with flash off (Grey Dashed), compared with RR measured using self reporting. In each set of data their are 5 subgroups based on skin types, Caucasian male (Triangle Up Fill), Caucasian female (Triangle Up), African male (Triangle Down Fill), Africa female (Triangle Down) and Indian Male (Empty Box).

