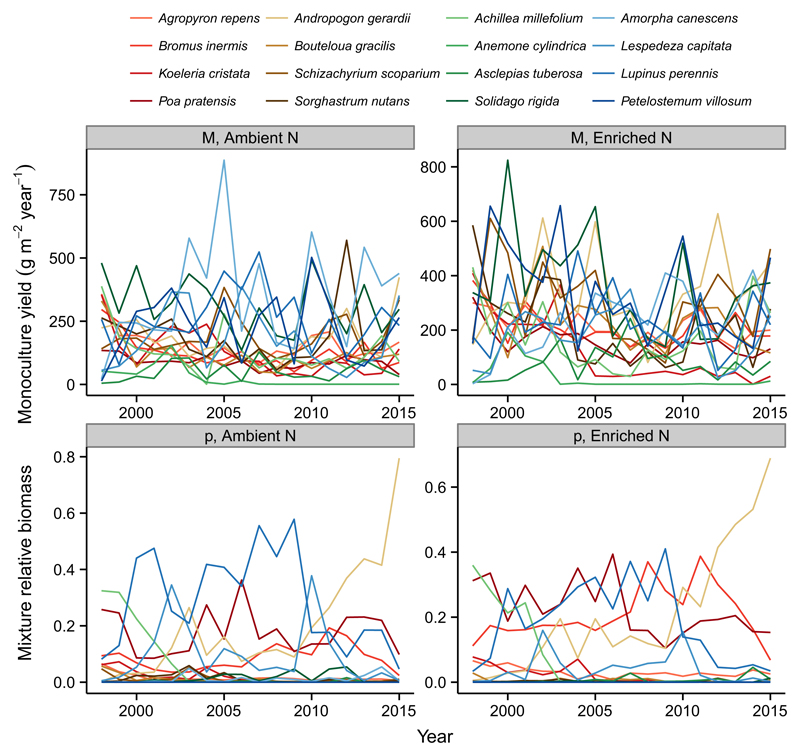
Figure 3.
Variation over time in monoculture yields (top) and mixture relative biomasses (bottom) for ambient (left) and enriched (right) rates of N supply for the BioCON experiment. Different species become highly productive in monoculture during different years and under different rates of N supply. The rank order of species’ mixture relative biomasses also changes substantially over time and between N treatments. Without these changes in the identities of highly productive and dominant species over time and between environmental conditions, there could be no covariance between them and thus no insurance effects of biodiversity on ecosystem productivity. Line colours correspond to plant functional groups: reds = C3 grasses, browns = C4 grasses, greens = non-N-fixing forbs, blues = N-fixing forbs.

