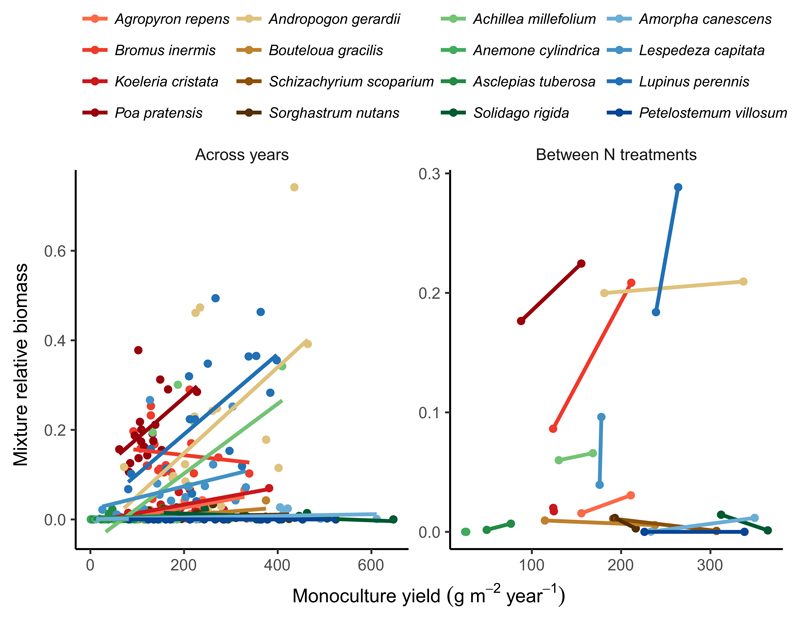
Figure 4.
Covariation between monoculture yields and mixture relative biomasses over time (left) and between ambient and enriched rates of N supply (right) for the BioCON experiment. Positive sloping lines indicate that species increasingly dominated mixtures during the years (left) or under the rates of N supply (right) in which they were most productive in monoculture. These positive covariances partly explain why increasing plant species richness increases ecosystem productivity across multiple years and environmental conditions (i.e. N supply rates). Symbol and line colours correspond to plant functional groups: reds = C3 grasses, browns = C4 grasses, greens = non-N-fixing forbs, blues = N-fixing forbs.

