
Fig. 2.
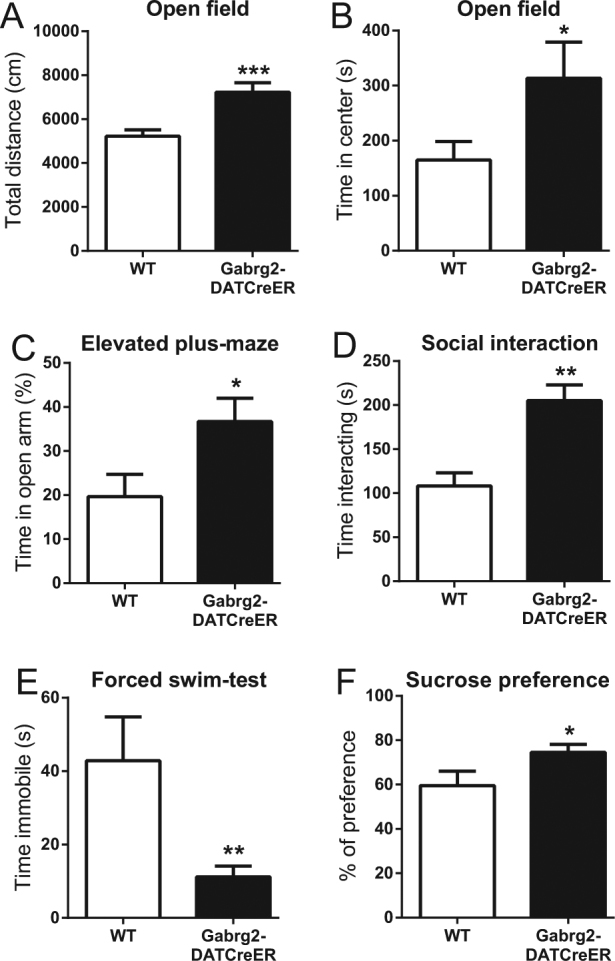
Basic behavioral testing in Gabrg2DATCreER mice. Behavior in the open-field test. a show total distance and b show the time spent in the center of the field (n = 21 and 16). Behavior in the elevated plus maze is shown in c (n = 13 and 15) and time spent interacting in the reciprocal social interaction test is shown in d (n = 6 and 6). e show the time spent immobile in the forced swim test (n = 6 and 13) and f show the sucrose preference in Gabrg2DATCreER and WT mice (n = 8 and 14). Error bars represent SEM. *p < 0.05, **p < 0.01, ***p < 0.001, Student’s t test