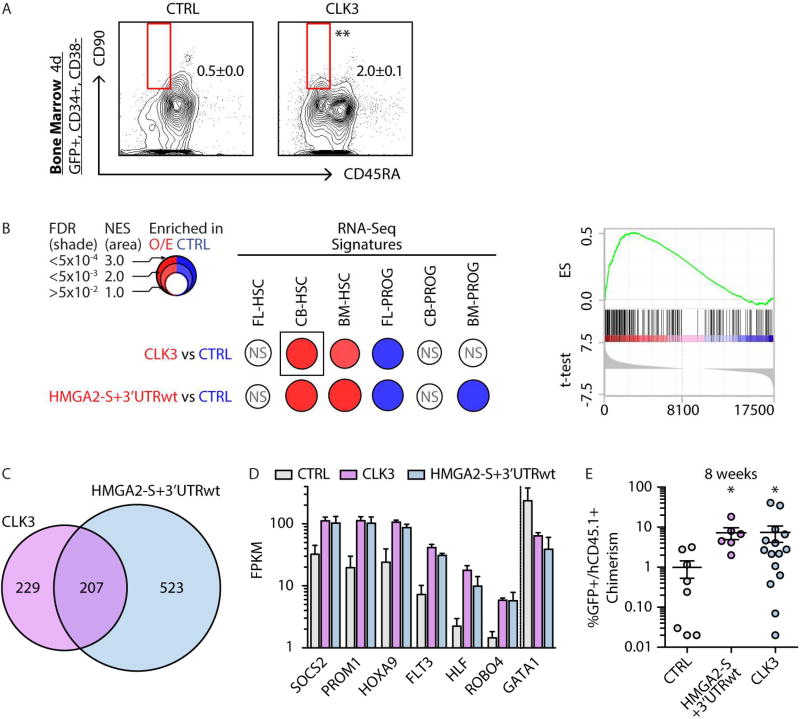
FIGURE 7. _CLK3 HMGA2 axis orchestrates an HSC-specific program.
A- Phenotypic analysis of HSC content in BM CD34+ cells transduced with control (CTRL) or CLK3 lentiviral constructs 4 days post-infection. Mean +/− s.e.m. values are shown. Unpaired t-test was used, p-value <0.01 (**).
B- BubbleMap visualization (Spinelli et al., 2015) of GSEA results in BM-HSCs upon CTRL, CLK3 or HMGA2-S-wt overexpression. Gene sets were derived from HSC and PROG -specific signatures from Figure 1C (see Table S2C). As indicated in the legend, colors (red versus blue) correspond to the sample label, shades represent statistical significance (FDR) and the area of the circle represents the enrichment (Normalized Enrichment Score, NES). Empty circles correspond to non-significant (NS) enrichments (FDR>0.05). Representative GSEA plot of the boxed BubbleMap is shown on the right.
C- Venn diagrams of genes significantly DE (FDR<0.05) upon CLK3 or HMGA2-S+3’UTRwt overexpression.
D- RNA-seq based expression (in FPKM) of representative genes upon CTRL, CLK3 and HMGA2-S+3’UTRwt overexpression in BM HSCs. Mean +/− s.d. values are shown. Cufflinks FDR <0.05 in all comparisons.
E- Human chimerism as percentage of GFP+CD45.1+ in the injected femur of xenografted mice 8 weeks after transplantation of BM CD34+ HSPCs transduced with lentivirus for HMGA2-S+3’UTRwt, CLK3, or control (CTRL). Individual sample, mean +/− s.e.m. values are shown. Mann-Whitney test was used to individually compare each indicated sample with respect to CTRL , p-values: <0.05 (*).

