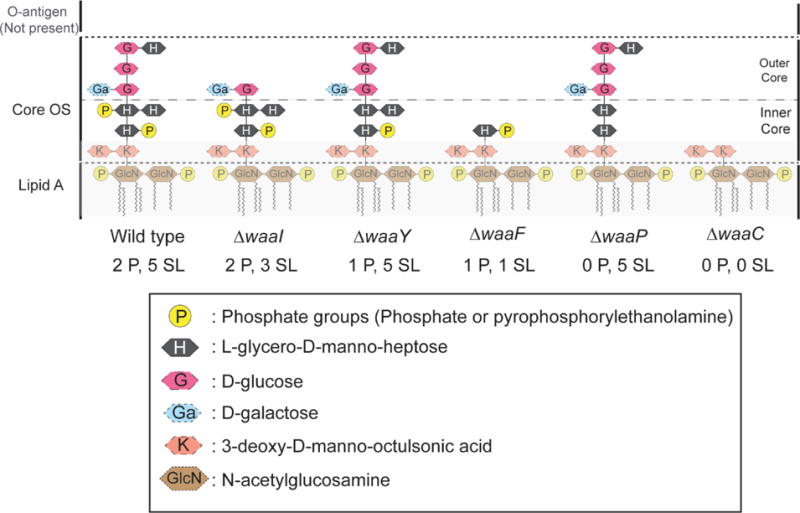
Figure 1.

Cartoon representation of the LPS layer of E. coli K12. Each mutation of WT BW25113 (Table 1) alters the core OS sugar layers and phosphoryl charges as shown. The notation (n P, m SL) denotes the presence of n phosphoryl charges on heptose layers and m total sugar layers above the Kdo layer. Adapted from Ref. [8].
