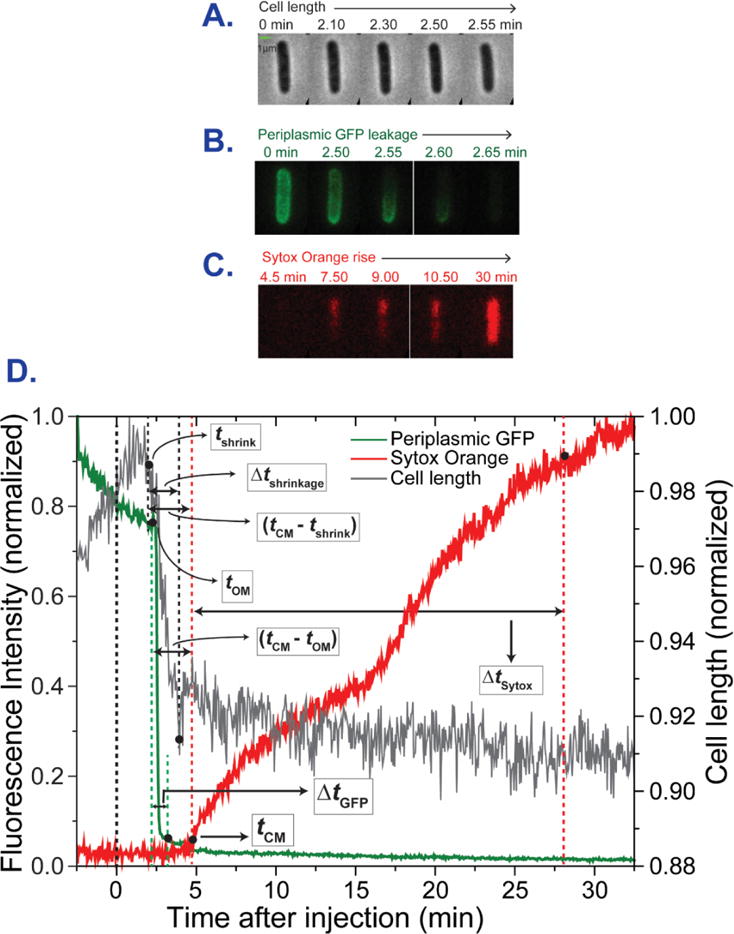
Figure 2.

Sequence and timing of events for a typical WT GFP, non-septating cell subjected to a constant flow of 0.5 μM Cecropin A and 5 nM Sytox Orange beginning at t = 0. Three-channel, two-color imaging with 3 s cycle time. (A) Phase contrast images. (B) Green (GFP) fluorescence images. (C) Red (Sytox Orange) fluorescence images. (D) Plots of cell length (from phase contrast images), total green fluorescence (GFP), and total red fluorescence (Sytox Orange) vs time. The single-cell timing events described in the text are extracted from such plots.
