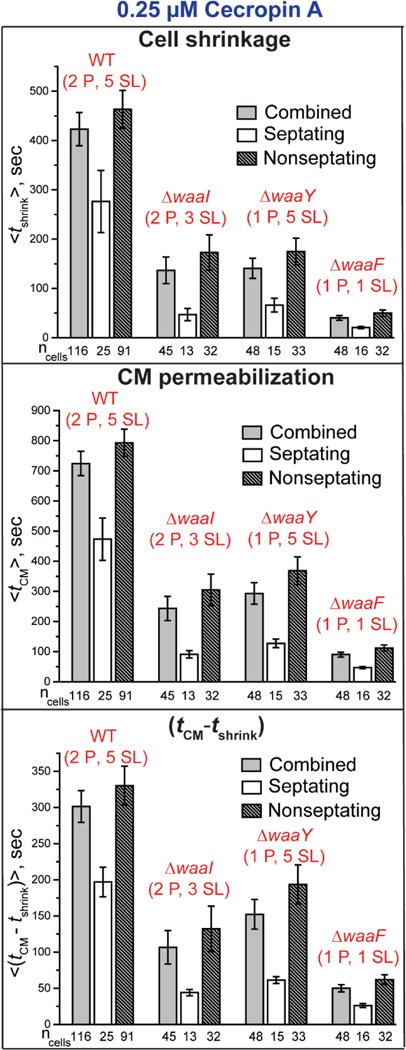
Figure 5.

Comparison of the mean timing of the onset of cell shrinkage and CM permeabilization events (from phase contrast and Sytox Orange imaging, respectively) at 0.25 μM Cecropin A across the strains WT (2 P, 5 SL), (2 P, 3 SL), (1 P, 5 SL), and (1 P, 1 SL). For each strain, data are shown for all cells and for septating and non-septating cells. Error bars are ± 1 SEM for the number of cells indicated. See Table S3 for detailed numerical values.
