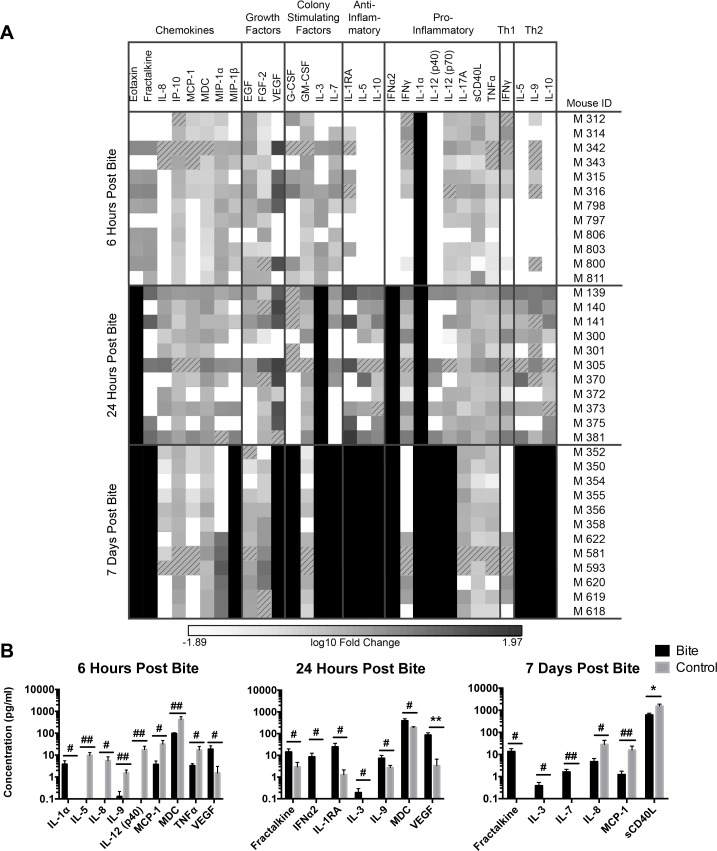
Fig 7. Mosquito saliva alters concentrations of select serum cytokines in hu-NSG mice.
(A) Serum cytokine production in hu-NSG mice following mosquito bite. Hu-NSG mice were each bitten by approximately four mosquitoes on a rear footpad. Unbitten mice were used as controls. At the indicated times, mice were euthanized and serum cytokine levels were determined via multiplex cytokine bead array assay. Data presented are the log10 fold change of specific cytokine concentrations in each bitten mouse compared to the mean concentration of the control mice. Darker colors represent a higher concentration of a given cytokine in the serum of the bitten mice. Pure black represents a positive ∞ log10 fold change (highest possible), while pure white represents a negative ∞ log10 fold change (lowest possible). Slashed squares represent missing data or outlier data. Data for the following cytokines were not included in the analysis because all mice had serum concentrations below the limit of detection: Flt3 ligand, GRO, IL-1β, IL-2, IL-4, IL-6, IL-13, IL-15, MCP3, TGFα, and TNFβ. (B) Significant differences in serum cytokine levels between bitten mice (black) and control mice (gray). Graphs show mean concentrations (pg/mL) of cytokines; error bars are 1 SEM. T-tests were performed on serum cytokine concentration data (with outliers removed) from (A) using GraphPad Prism. Multiple comparisons were corrected for using the Holm-Sidak method, which increased the significance threshold to p < 0.01. #, p<0.1; ##, p<0.05; *, p<0.01; **p<0.005.

