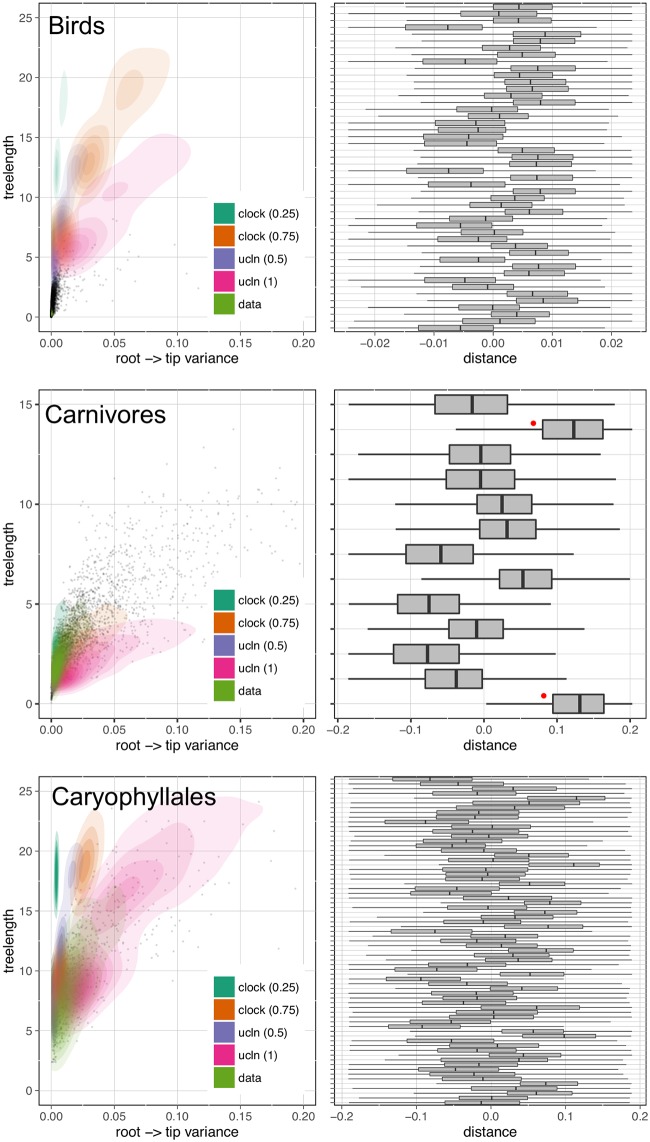
Fig 2. Gene tree properties for the BIR, CAR, and CARY datasets.
Left: relationship between root-to-tip variance and tree length for simulated (clock and ucln) and empirical (data) datasets. Each simulation condition consists of 100 simulated datasets. Contours represent densities, while grey dots represent raw empirical values. Right: tip-specific root-to-tip variance for empirical datasets. Here, 0 represents the mean root-to-tip across all genes and all lineages. Red dots indicate outgroup taxa.

