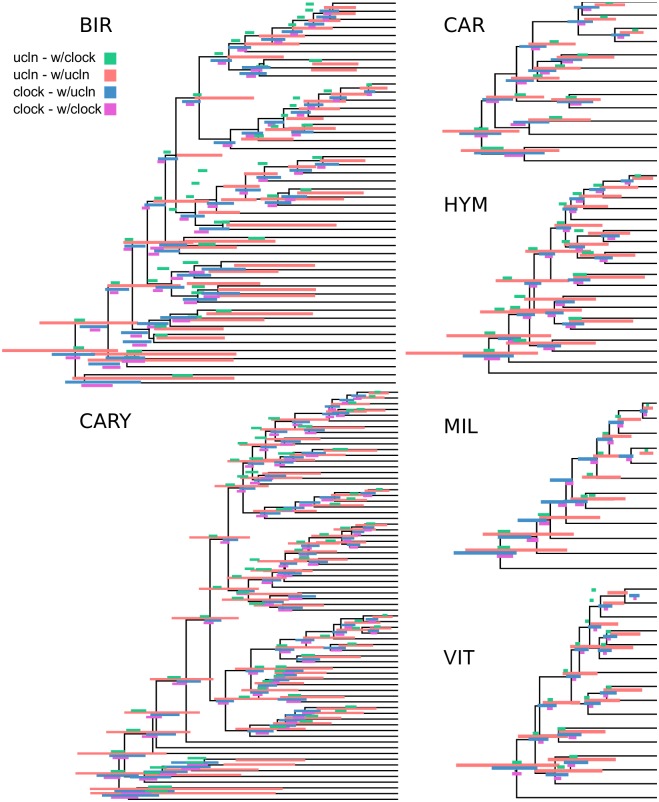
Fig 5. A comparison of strict clock and UCLN estimates of node ages for the simulated clock and ucln datasets.
Each simulation condition consists of three genes. Red and pink are scenarios where the generating and inference models are identical, while green and blue are where the models are mismatched. Bars represent 95% HPD intervals and overlay the true simulated tree.

