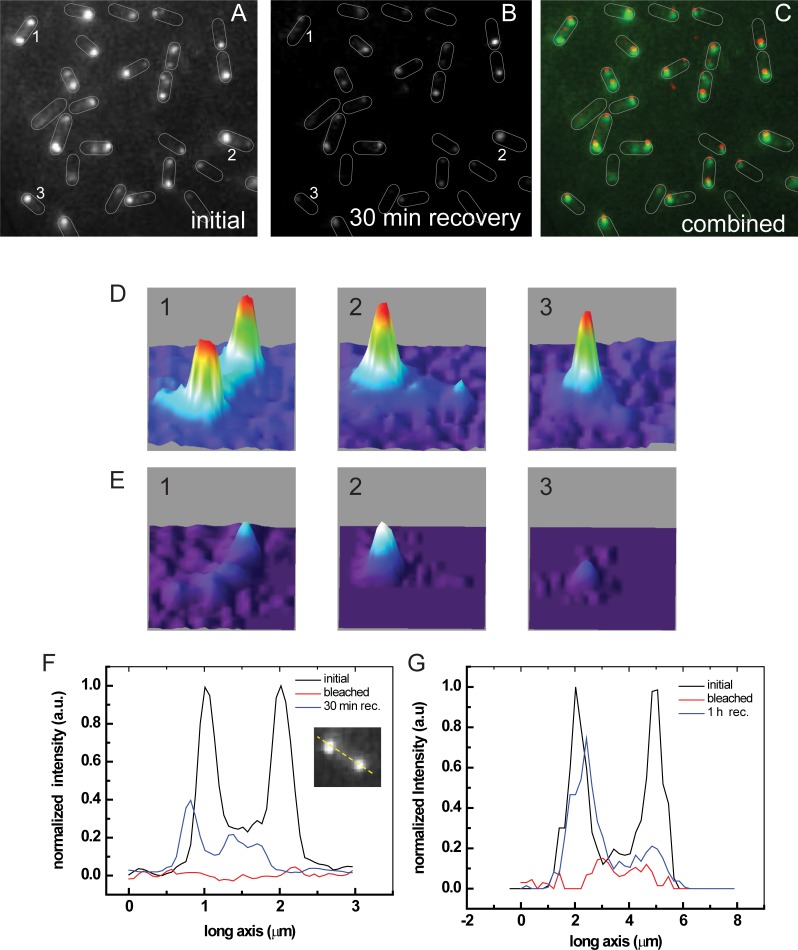
Fig 2. Whole cell recovery after photobleaching.
A) Fluorescence before photobleaching (pre-bleach). B) Fluorescence after 30 min recovery (post recovery). C) Combined image (Green: pre-bleach, Red: post recovery). Overlaid cell boundaries have been added to guide the eye. D) Initial fluorescence of cells 1, 2, and 3 in Panels A. E) Fluorescence of cells 1, 2, and 3 after photobleaching and 30 min. recovery showing fast recovery of one pole and slow recovery of other pole. F) and G) Fluorescence profiles showing asymmetric recovery after 30 min and 1 hour, respectively.

