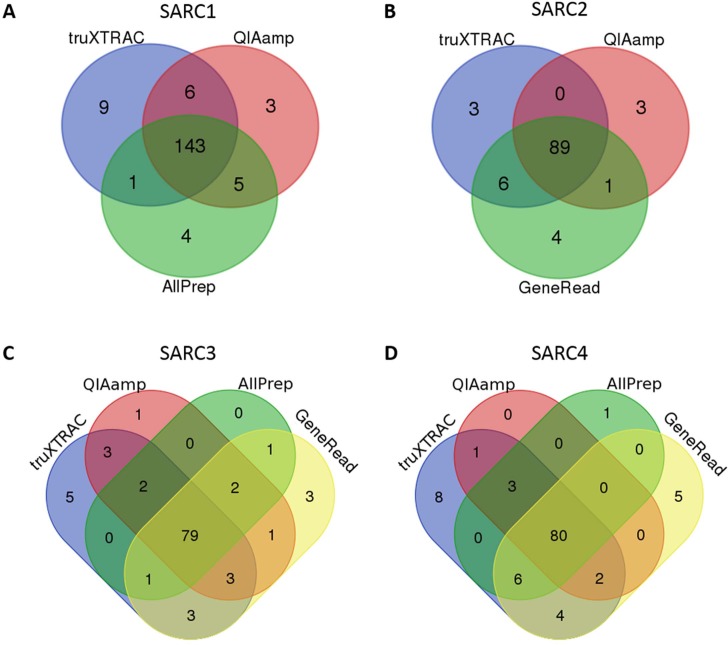
Fig 2. Variants identified in the samples extracted with different DNA extraction methods.
(A-D) Venn diagram showing the distribution of variants between DNA extraction methods in four different FFPE samples, SARC1-4. Variants were detected by MuTect and Strelka, using an artificial control as normal. The data was filtered on exonic variants with allele frequency > 5% and coverage > 100x, being present at < 1% in the normal population (ExAC database).

