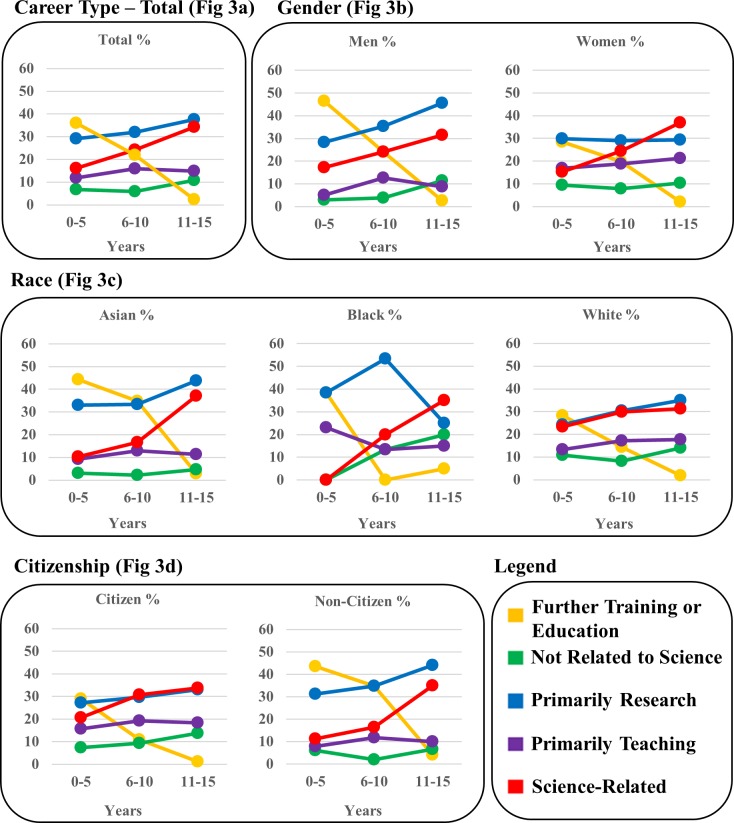
Fig 3. Tier 2 (Career Type) outcomes.
Employment data are shown as percent of WSU’s biomedical doctoral alumni depicted in three 5-year windows to visualize employment shifts over time following graduation. Fig 3A shows total alumni, Fig 3B shows Gender (men and women), Fig 3C shows Race (Asian, Black, White), and Fig 3D shows U.S. citizenship status (U.S. citizens and non U.S. citizens).

