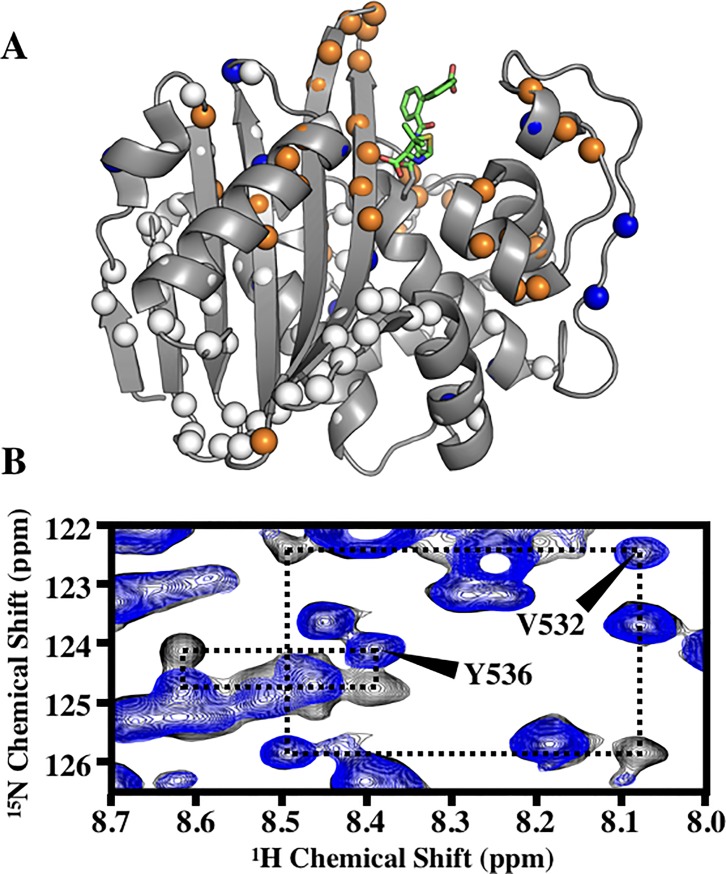
Fig 3. Slow exchange and amide CSPs from CBAP-acylation of BlaRS.
(A) Residues demonstrating slow chemical exchange (orange spheres) and significant CSPs (blue spheres) are mapped onto PDB 3Q7Z. Spheres indicate residues assigned in both apo and CBAP-acylated BlaRS. Green sticks represent the bound β-lactam CBAP. (B) Pronounced 15NH-1H exchange squares of V532 and Y536 of U-[15N] 80% deuterated CBAP-acylated BlaRS. Spectra were recorded at 18.8 T and T(nom) = 293.8 K; 15N TROSY (Blue) versus EXSY-R1 TROSY (black) using a 400 ms exchange relaxation delay.

