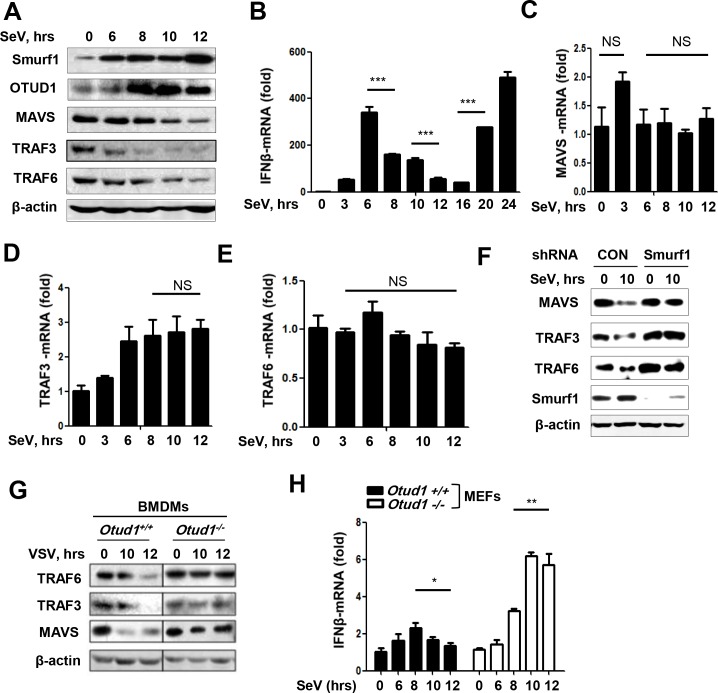
Fig 8. The OTUD1-Smurf1 axis regulates MAVS/TRAF3/TRAF6 levels and IFNβ induction during RNA virus infection.
(A) Immunoblot analysis of the indicated proteins in the whole cell lysates of HepG2 cells infected with SeV (MOI = 3) for the indicated times. (B) 2fTGH cells were infected with SeV (MOI = 3) for the indicated times. Relative mRNA amounts of IFNβ were determined by q-PCR. The data were shown as fold change normalized to that in uninfected cells. (C-E) Relative mRNA amounts of MAVS (C), TRAF3 (D) and TRAF6 (E) in 2fTGH cells with SeV infection were determined by q-PCR. The data were shown as (B). (F) HeLa cells were transfected with shCON or shSmurf1, and then infected with SeV (MOI = 3). The levels of the indicated proteins were examined by immunoblotting. (G) BMDMs from Otud1+/+ or Otud1-/- mice were infected with VSV (MOI = 3). The levels of the indicated proteins were examined by immunoblotting. (H) Otud1+/+ or Otud1-/- MEF cells were infected with SeV for indicated times. Relative mRNA amounts of IFNβ were determined by q-PCR. The data were shown as fold change normalized to that in uninfected Otud1+/+ MEFs. NS, not significant (P>0.05); *P<0.05, **P<0.01 and ***P<0.001 (unpaired t-test). Error bars represent the mean and s.d., and all data are representative of three independent experiments.

