
Fig. 4. Changes in non-coding RNA transcription predict changes in gene transcription.
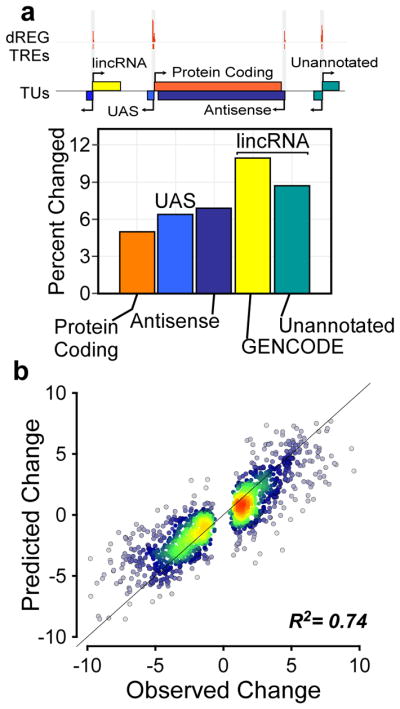
(a) The fraction of each indicated class of RNAs that undergo changes in transcription in human CD4+ T-cells (see Online Methods). The relationships among the indicated classes of transcription units are depicted at top. (b) Scatterplot shows the magnitude of changes in transcription predicted for protein-coding genes using changes in the transcription of nearby non-coding RNAs (y-axis) as a function of changes observed (x-axis). The line has a slope of 1 and an intercept of 0.