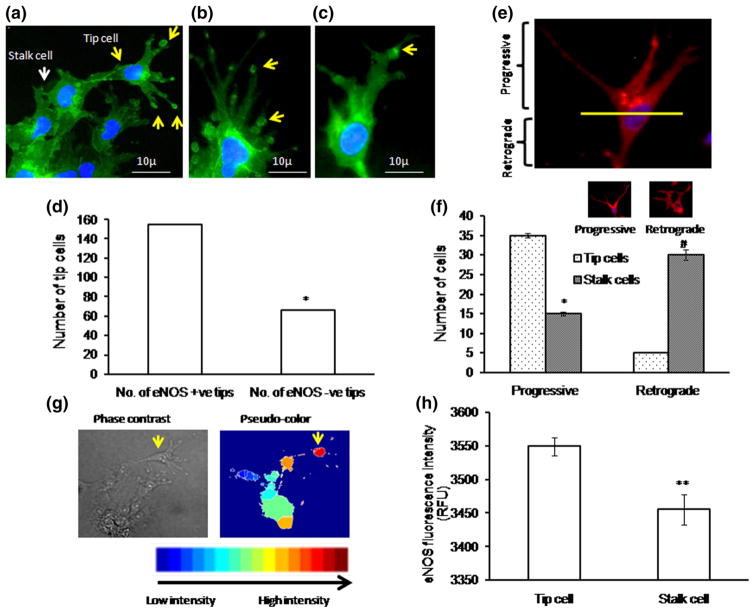
Fig. 6.
eNOS localization in tip cell: a–c eNOS immunofluorescence imaging shows that eNOS expression is high in tip cells and at the apex of the tip cells. eNOS hot spots were found to be more at the tip of the tip cells (yellow arrow) than the stalk cells (white arrow). Nuclear staining was done using DAPI (blue color). d Representative graph shows that within the tip cell, eNOS is highly enriched in the tip of the tip cell (n ≥ 3, *p<0.05 vs number of eNOS +ve tips). Tip cells which contain eNOS hot spots at the apex of the tip cells were defined as eNOS +ve tips and which do not have eNOS hot spots at the apex of the tip cells were defined as eNOS −ve tips. Based on the eNOS hot spots at the apex of the tip cells, eNOS +ve tip cells and eNOS −ve tip cells were manually counted as a double-blinded study. Almost 200 cells were chosen, and eNOS +ve and −ve tips were counted and plotted. e Fluorescence microscopic results showed the peri-nuclear progressive eNOS (Golgi) localization pattern in tip cells and retrograde eNOS (Golgi) localization pattern in stalk cells. eNOS localization above the nucleus is defined as progressive, and below the nucleus is defined as retrograde. f Representative graph shows significant increase in tip cell number toward progressive end (n ≥ 3, *p<0.001 vs tip cells progressive and #p<0.001 vs tip cell retrograde). g Immunofluorescence (eNOS) images were captured, and 50 images were processed in MATLAB software for image analysis. Pseudo-color was assigned to the bright field eNOS image to analyze the eNOS pattern in tip cells and stalk cells. h Graphical results showed high eNOS intensity in tip cells compared with that in neighboring stalk cells (n ≥ 3, **p<0.001 vs tip cells). (Color figure online)

