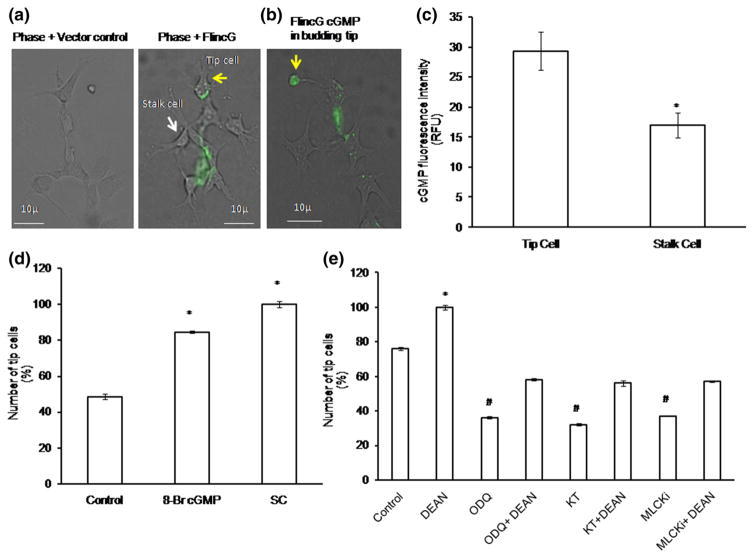
Fig. 8.
cGMP live imaging using FlincG and NO downstream pathway dissection: a EA.hy926 cells were electroporated with FlincG-GFP plasmid and allowed to form tip cells on the Matrigel-coated coverslips. After 36 h of transfection, the cells were treated with 10 μM of DEAN and live images were taken using fluorescence microscope. Representative images of phase + vector control and phase + FlincG transfected cells. Yellow arrow mark denotes tip cells, and white arrow mark denotes stalk cells. b Representative image shows that cGMP level was found to be high in the budding tip cell (yellow arrow). c cGMP fluorescence intensity calculations were analyzed using Adobe Photoshop 7.0. Tip cells showed high fluorescence intensity than stalk cells. The images are representative of ten different culture plates (n>3; *p = 0.002 vs tip cells). d Compared to control, significant increase in tip cell number was observed under 8-Br-cGMP and SC (n = 3, *p<0.05 vs control). e After 4 h of cell seeding, EA.hy926 cells were treated with NO downstream pharmacological inhibitors such as KT, ODQ, and MLCKi, and the number of tip cells was counted manually. Statistically significant decrease in tip cell number was observed under KT, ODQ, and MLCKi, whereas combination of NO donor DEAN, with the above-said inhibitors showed significant increase in tip cell sprouting (n = 3; *p<0.05 vs control, #p<0.001 vs control). (Color figure online)

