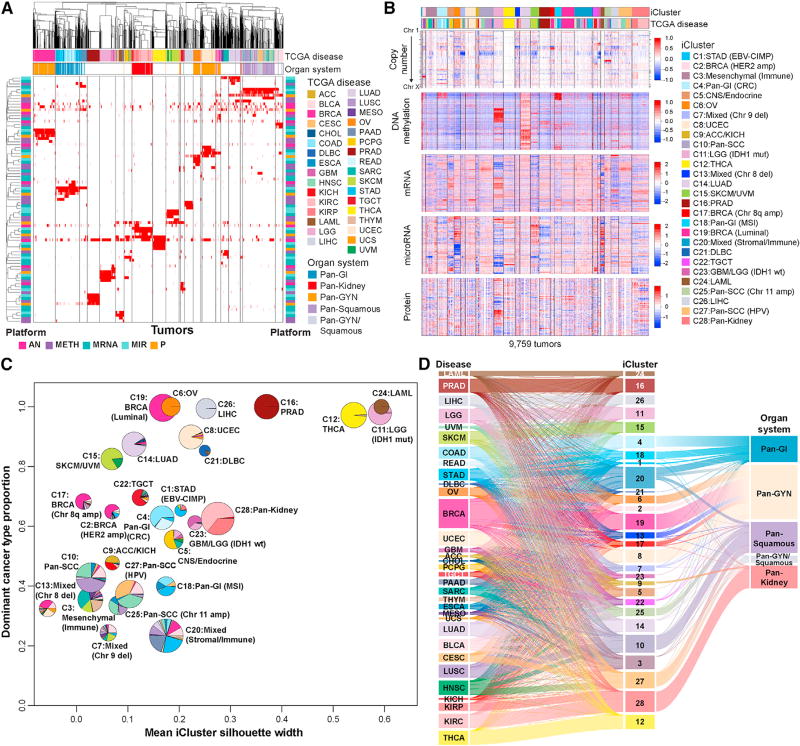
Figure 2. Cross-Platform Classification Revealed Genomic, Epigenomic, and Transcriptomic Similarities and Differences across Cancer Types.
(A) COCA clusters. Membership for individual clusters for each of the five molecular platforms—aneuploidy (AN), methylation (Meth), miRNA expression (miR), mRNA, and RPPA—is displayed as a separate binary membership variable in a distinct row. For the mRNA platform, only clusters containing >40 samples were considered. Samples are labeled for membership of each platform-specific cluster (red, member; white, non-member; gray, not evaluated on the platform). Order of samples and platform-specific clusters were determined by hierarchical clustering using a binary distance matrix and average linkage. Column annotation shows cancer type and tissue organ systems of each sample; row annotations reflect the platform for each classification (bright pink, AN; purple, Meth; light turquoise, miR; dark turquoise, mRNA; orange, RPPA).
(B) iCluster. Data used for integrated analysis of iClusters. RPPA data are also included in the heatmap to visualize proteomic patterns across the integrated clusters.
(C) iCluster robustness versus composition. Pie charts show the cancer-type composition within each iCluster and the size is proportional to the membership size. The cancer type accounting for the highest proportion of members within the iCluster was considered the dominant cancer type. They coordinate of each pie center reflects this dominant cancer-type proportion; the x coordinate was determined by the iCluster silhouette width.
(D) Relationship of TCGA tumor type, iCluster, and Pan-Organ system. The Sankey diagram demonstrates the tumor-type composition of each iCluster. The pan-cancer designations are shown on the right.

