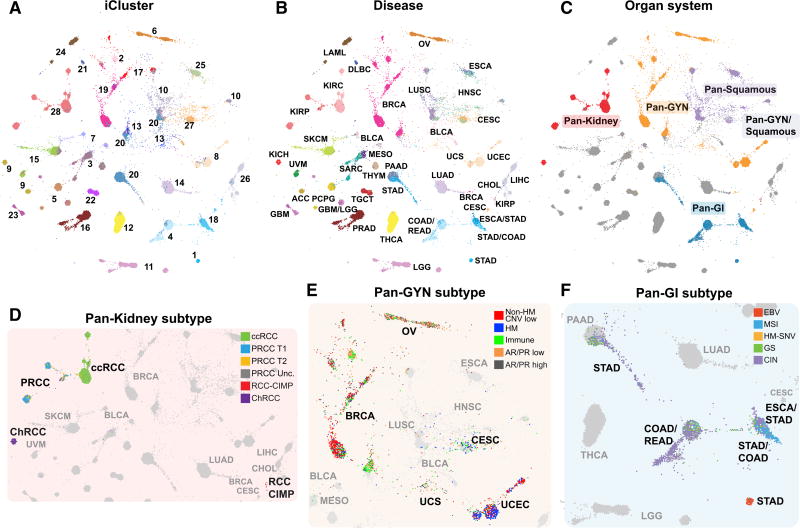
Figure 4. The iCluster TumorMap.
(A–F) The map layout was computed from sample Euclidean similarity in the iCluster latent space, and similar samples are positioned in close proximity to each other. Each spot represents a single sample and is colored to represent attributes as described for each panel including (A) iCluster, (B) disease type, and (C) organ system. Organ systems highlighted include pan-kidney, red; pan-gyn, orange; pan-GI, blue; pan-squamous, purple; and those that overlap pan-gyn and pan-squamous, light purple.
(D) Subtypes from the pan-kidney analysis (Ricketts et al., 2018). Clear cell renal cell carcinoma (ccRCC), green; papillary renal cell carcinoma type 1 (PRCC T1), blue; papillary renal cell carcinoma type 2(PRCC T2), yellow; unclassified papillary renal cell carcinoma (PRCC Unc.), dark gray; CpG island methylator phenotype renal cell carcinoma (RCC-CIMP), red; and chromophobe renal cell carcinoma (ChRCC), purple.
(E) Subtypes from the pan-gyn group (Berger et al., 2018). Not hypermutated, with low copy-number changes (non-HM CNV low), red; hypermutated, with low copy-number changes (HM), blue; high levels of leukocyte infiltration (immune), green; low AR or PR expression (AR/PR low), orange; and high androgen receptor (AR) or progesterone receptor (PR) expression (AR/PR high), dark gray.
(F) Subtypes from the pan-GI group (Liu et al., 2018). High Epstein-Barr virus (EBV) burden, red; microsatellite instability (MSI), blue; hypermutated without MSI (HM-SNV), gold; chromosomal instability tumors (CIN), purple; and genome stable (GS) with low aneuploidy, green. The gray dots represent non-highlighted diseases.

