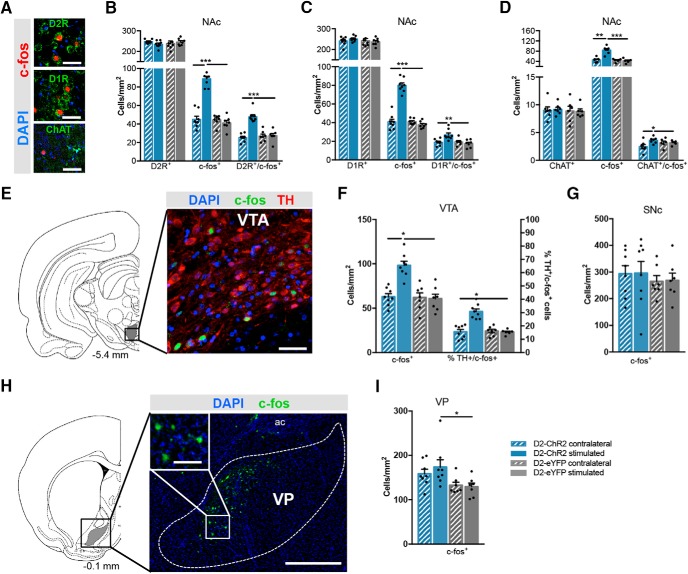
Figure 3.
Effect of optogenetic activation of D2-MSNs in the NAc and downstream targets. A, Representative immunostaining c-fos and D2R, D1R, or ChAT in the NAc. Scale bar: 80 μm (nD2-ChR2 = 8; nD2-eYFP = 7). B, Counting of D2R+ and c-fos+ cells in the NAc. D2-MSNs stimulation recruits more D2+ neurons in comparison to nonstimulated side (contralateral). Stimulated D2-ChR2 animals present increased number of D2+/c-fos+ neurons in comparison to stimulated D2-eYFP animals (control group). C, Counting of D1R+ and c-fos+ cells in the NAc, showing an increase in D1+/c-fos+ in stimulated versus contralateral side (or vs D2-eYFP-stimulated animals). D, Counting of ChAT+ and c-fos+ cells in the NAc, showing an increase in ChAT+/c-fos+ in stimulated versus contralateral side (or vs D2-eYFP-stimulated animals. E, Representative immunostaining for TH and c-fos in the VTA (scale bar: 100 μm). F, Respective quantification of positive cells. D2-MSN stimulation increases the number of TH+ neurons in the VTA. G, SN c-fos+ cells counting showing no effect of stimulation. H, Representative immunostaining for c-fos in the VP (scale bar: 500 μm; scale bar in inset: 100 μm). I, Stimulated D2-ChR2 animals present increased c-fos staining in the VP comparison to control D2-eYFP animals; interestingly, no significant differences were found between stimulated versus nonstimulated side. Error bars denote SEM; *p < 0.05, **p < 0.01, ***p < 0.001 (Extended Data Fig. 3-1).

