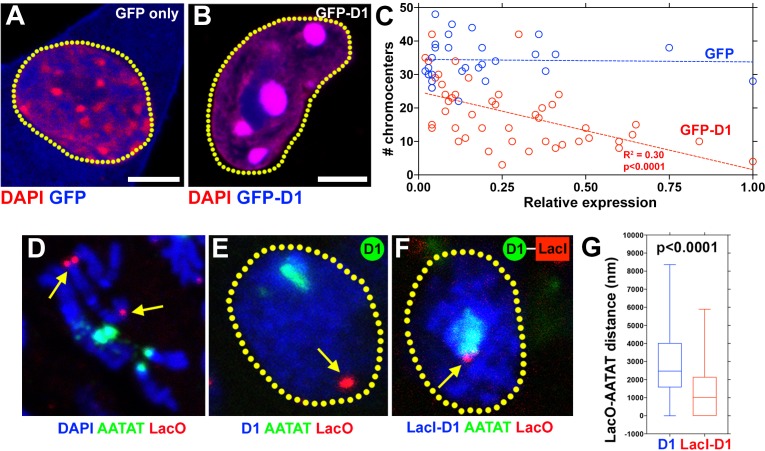
Figure 5. D1 bundles satellite DNA from heterologous chromosomes to form chromocenter.
(A, B) C2C12 cells expressing GFP only (blue) (A) or GFP-D1 (blue) (B) stained for DAPI (red). Dotted lines indicate nucleus. (C) Quantification of chromocenter number relative to expression level of GFP (n = 29) or GFP-D1 (n = 47). P value and R2 value are indicated from linear regression analysis. (D) FISH against LacO (red) and {AATAT}n (green) on mitotic neuroblast chromosomes from the LacO strain stained for DAPI (blue), indicating the sites of LacO insertion (arrows). (E, F) FISH against LacO (red) and {AATAT}n (green) in spermatogonia expressing GFP-D1 (blue) (E) or GFP-LacI-D1 (blue) (F). Arrows indicate location of LacO sequence. (G) AATAT-LacO distance (nm) in GFP-D1 (n = 97) and GFP-LacI-D1 (n = 69) expressing spermatogonia. P value from student’s t-test is shown. Error bars: SD. All scale bars: 5 μm.

