. 2018 May 2;7:e34836. doi: 10.7554/eLife.34836

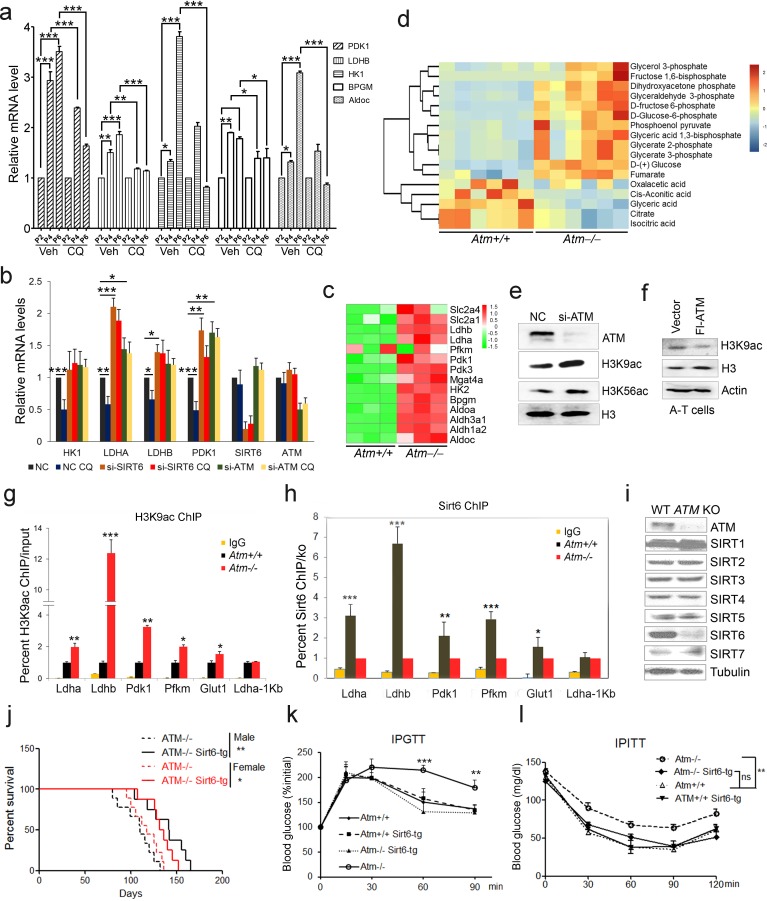
Figure 2. ATM-SIRT6 axis regulates age-related metabolic reprogramming.

(a) Quantitative RT-PCR analysis of mRNA levels of indicated glycolytic genes in different passages of MEFs with or without treatment of CQ. Data represent means ± SEM. *p<0.05, **p<0.01, ***p<0.001. (b) Quantitative RT-PCR analysis of mRNA levels of indicated glycolytic genes in Scramble (NC), si-SIRT6 or si-ATM HepG2 cells incubated with or without CQ (10 μM, 6 hr). Data represent means ± SEM. *p<0.05, **p<0.01, ***p<0.001. (c) Heatmap representation of RNA-Seq data (GSE109280) showing relative changes of glycolytic genes in Atm-/- MEF cells. The transcript levels are qualified in reads per kilobase of exon per million mapped sequence reads (RPKM), which is a normalized measure of exonic read density. Red and green indicate up- and downregulation, respectively. (d) Heatmap showing relative levels of metabolites in Atm+/+ and Atm-/- MEF cells of p53 null background, analyzed by LC-MS. Red and blue indicate up- and downregulation, respectively. (e) Immunoblots showing protein levels of H3K9ac and H3K56ac in ATM-deficient HepG2 cells. (f) Immunoblots showing levels of H3K9ac in A-T cells reconstituted with Flag-ATM. (g) ChIP analysis showing enrichment of H3K9ac at the promoter regions of indicated genes in Atm+/+ and Atm-/- MEFs. Data represent means ± SEM of three independent experiments. *p<0.05, **p<0.01, ***p<0.001. (h) ChIP analysis showing enrichment of Sirt6 at the promoter regions of indicated genes in Atm+/+ and Atm-/- MEFs. Data represent means ± SEM of six independent experiments. *p<0.05, **p<0.01, ***p<0.001. (i) Immunoblots showing protein levels of sirtuins in wild-type (WT) and ATM knockout (KO) HEK293 cells. (j) Kaplan-Meier survival of Atm-/- and Atm-/-;Sirt6-Tg male (n = 11 in each group) and female (n = 9 in each group) mice. **p<0.01. (k) Results of glucose tolerance tests in Atm+/+, Atm-/-, and Atm-/-;Sirt6-Tg mice. Data represent means ± SEM, n = 6. **p<0.01, ***p<0.001. (l) Results of insulin tolerance tests in Atm+/+, Atm-/-, and Atm-/-;Sirt6-Tg mice. Data represent means ± SEM, n = 6. **p<0.01. ‘ns’ indicates no significant difference.

Figure 2—source data 1. Differently expressed mRNA profiles of Atm-/- MEF cells.
DOI: 10.7554/eLife.34836.011
Figure 2—source data 2. Differentially expressed Metabolites in Atm KO MEFs.
DOI: 10.7554/eLife.34836.012
Figure 2—source data 3. Differently expressed mRNA profiles of Sirt6-/- MEF cells.
DOI: 10.7554/eLife.34836.013

Figure 2.

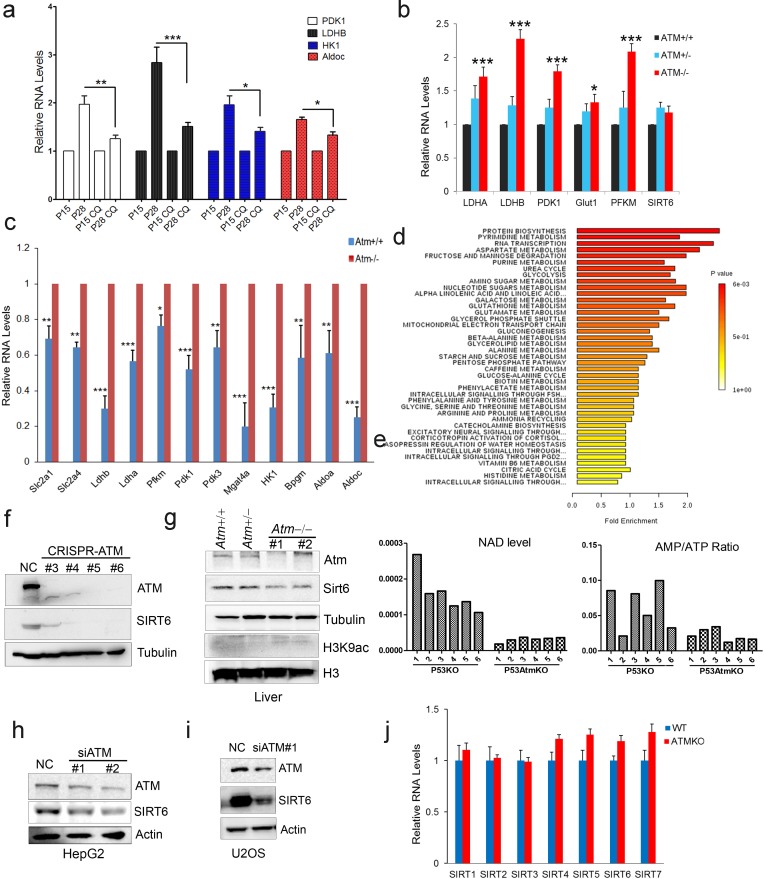
Figure 2—figure supplement 1. Atm deficiency promotes glycolysis.

Figure 2—figure supplement 1.

(a) Quantitative RT-PCR analysis of mRNA levels of indicated glycolytic genes in different passages of HSFs with or without treatment of CQ. Data represent means ± SEM. *p<0.05, **p<0.01, ***p<0.001. (b) Quantitative RT-PCR analysis of mRNA levels of glycolytic genes in liver tissues from Atm+/+, Atm+/-, and Atm-/- mice. Data represent mean ± SEM. Atm-/- Vs Atm+/+, *p<0.05, ***p<0.001. (c) Quantitative RT-PCR analysis of mRNA levels of glycolytic genes to validate the RNA-seq data set of Atm+/+ and Atm-/- MEFs. Data represent means ± SEM of six independent experiments. *p<0.05, **p<0.01, ***p<0.001. (d) Metabolic pathway enrichment in Atm null MEFs compared with wild-types. (e) AMP/ATP ratio and NAD + levels in wild-type and Atm null MEFs. (f) Immunoblots showing ATM and SIRT6 protein levels in indicated clones of ATM KO HEK293 cells generated by the CRISPR/Cas9 system. (g) Immunoblots showing protein levels of Sirt6 and H3K9ac in liver tissues from 4-month-old Atm+/+, Atm+/-, and Atm-/- mice. (h–i) Immunoblots showing SIRT6 levels in si-NC and si-ATM treated HepG2 and U2OS cells. (j) Quantitative RT-PCR analysis of sirtuin mRNA levels in wild-type and ATM KO HEK293 cells. Data represent means ± SEM.
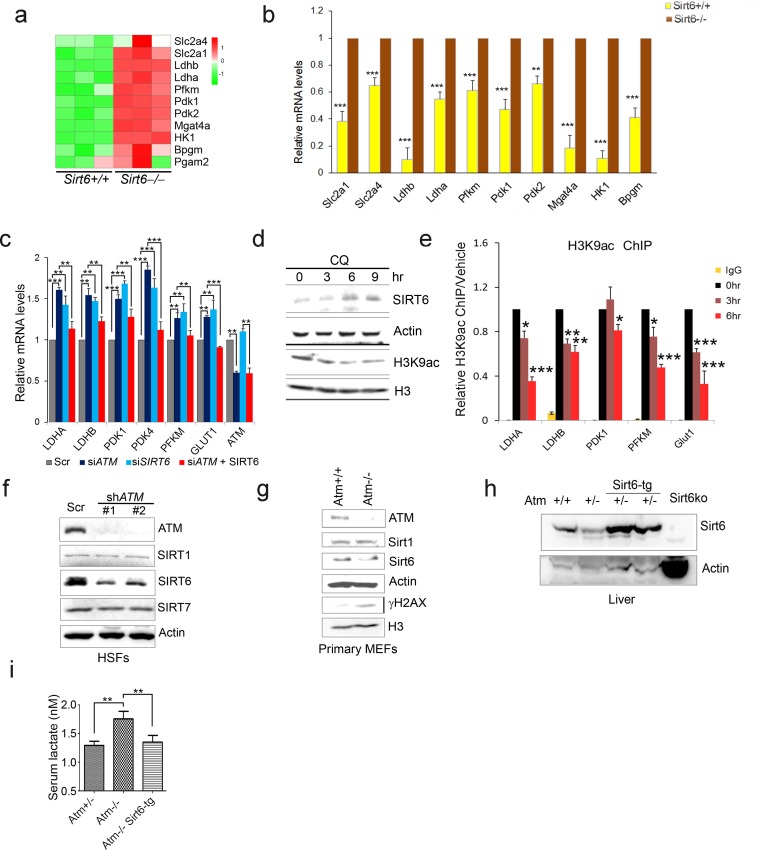
Figure 2—figure supplement 2. SIRT6 reduction underlies age-related metabolic reprogramming triggered by ATM decline.

Figure 2—figure supplement 2.

(a) Heatmap representation of RNA-Seq data showing relative changes of glycolytic genes in Sirt6-/- MEF cells. Red and green indicate up- and downregulation, respectively. (b) Quantitative RT-PCR analysis of mRNA levels of glycolytic genes to validate the RNA-seq data set of Sirt6+/+ and Sirt6-/- MEFs. Data represent means ± SEM of six independent experiments. **p<0.01, ***p<0.001. (c) Quantitative RT-PCR analysis of mRNA levels of indicated glycolytic genes in HepG2 cells transfected with Scramble, si-ATM, si-SIRT6, or si-ATM plus Flag-SIRT6. Data represent means ± SEM. *p<0.05, **p<0.01, ***p<0.001. (d) Immunoblots showing protein levels of SIRT6 and H3K9ac in HepG2 cells treated with 10 μM CQ for indicated periods of time. (e) ChIP analysis showing enrichment of H3K9ac at promoter regions of glycolytic genes in HepG2 cells treated with 10 μM CQ for indicated periods of time. Data represent means ± SEM. *p<0.05, **p<0.01, ***p<0.001. (f) Immunoblots showing SIRT1, SIRT6, and SIRT7 protein levels in ATM knockdown (KD) or control HSFs. (g) Immunoblots showing protein levels of Atm, Sirt1, Sirt6 and γH2AX levels in Atm+/+ and Atm-/- primary MEF cells. (h) Immunoblots showing Sirt6 expression in liver tissues of Sirt6-tg mice. (i) Serum lactate levels in 3-month-old Atm+/+, Atm-/- and Atm-/-;Sirt6-tg male mice. Data represent mean ± SEM of five to six animals/group. *p<0.05.