
Fig. 5. Markers of CD8+ T cells and TAMs correlate with response to PD1 blockade in human melanoma.
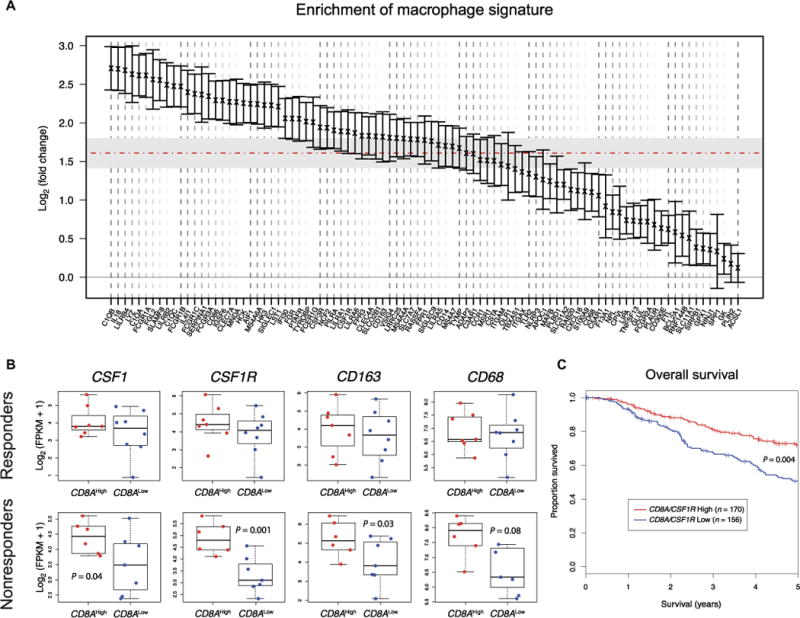
(A) Enrichment of melanoma-derived macrophage-specific transcriptional signature from (55) in CD8AHigh versus CD8ALow melanomas of the SKCM metastatic cohort (n = 369) (46). Genes are ranked based on mean fold change expression. Error bars indicate 95% confidence interval for each gene. The horizontal dashed line indicates mean fold change of the macrophage signature. Gray region indicates 95% confidence interval of the overall mean fold change. (B) CSF1, CSF1R, CD163, and CD68 expression in responder (n = 15) and nonresponder (n = 13) melanomas to anti-PD1 therapy, obtained from (56). Stratification as CD8AHigh or CD8ALow was performed using the median expression. Statistical analysis by Student’s t test. FPKM, fragments per kilobase of transcript per million mapped reads. (C) Kaplan-Meier estimate of survival in the SKCM metastatic cohort (n = 326, for which survival data were available) of TCGA (46), stratified as (CD8A/CSF1R) ratio high (n = 170) or (CD8A/CSF1R) ratio low (n = 156), using median ratio as cutoff value. The CD8A/CSF1R ratio denotes the numeric difference between log-transformed expression data. P value was obtained using the log-rank test and adjusted for tumor stage.