
Fig. 6. CSF1R blockade enhances the therapeutic efficacy of anti-PD1 treatment in BRAFV600E-driven transplant melanoma models.
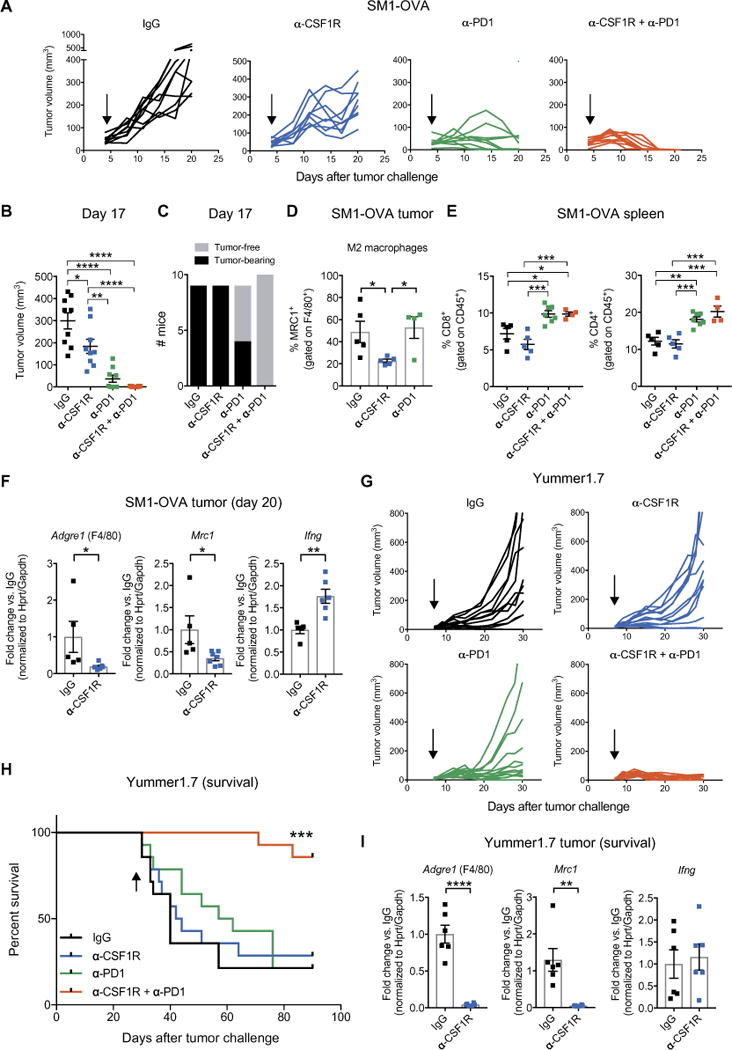
(A) Tumor volumes of subcutaneous SM1-OVA melanomas treated as indicated. IgG (n = 9), α-CSF1R (n = 9), α-PD1 (n = 9), and α-CSF1R + α-PD1 (n = 10). Arrows indicate start of treatment. (B) SM1-OVA tumor volumes (means ± SEM), measured at day 17 after tumor inoculation. Each dot represents one tumor. Statistical analysis by one-way ANOVA with Tukey’s correction for multiple comparisons. (C) Number of tumor-free and SM1-OVA tumor-bearing mice on day 17 after tumor inoculation. (D) Percentage of MRC1+ (M2-like) TAMs (means ± SEM) at day 20 after tumor inoculation, determined by flow cytometry of whole tumor-derived cells. Each dot represents one tumor. Flow cytometric analysis was performed on tumors selected for having a comparable size (only the smaller tumors in the IgG and CSF1R were analyzed) from the experiment shown in (A). IgG (n = 5), α-CSF1R (n = 5), and α-PD1 (n = 4). Note that tumors in the combination group could not be analyzed because they had fully regressed by day 20. Statistical analysis by one-way ANOVA with Fisher’s least significant difference (LSD) test. (E) Percentage of splenic CD8+ or CD4+ T cells (means ± SEM) determined by flow cytometry. IgG (n = 5), α-CSF1R (n = 5), α-PD1 (n = 7), and α-CSF1R + α-PD1 (n = 4). Flow cyto-metric analysis was performed on spleen from mice also used in (D). For the α-PD1 group, three additional spleens from mice whose tumors had regressed were used to exclude differences between tumor-free and tumor-bearing mice. Each dot represents one spleen. Statistical analysis by one-way ANOVA with Tukey’s correction for multiple comparisons. (F) qPCR analysis of Adgre1 (F4/80), Mrc1 (CD206), and Ifng from whole tumor lysates. Data indicate mean fold change values ± SEM over the reference sample (IgG) after normalization to the average of Hprt and Gapdh housekeeping genes. IgG (n = 5) and α-CSF1R (n = 6 to 7). Each dot represents one tumor; qPCR analysis was performed on tumors with similar size from the experiment shown in (A). Statistical analysis by Student’s t test. (G) Tumor volumes of subcutaneous Yummer1.7 melanomas treated as indicated. IgG (n = 14), α-CSF1R (n = 14), α-PD1 (n = 14), and α-CSF1R + α-PD1 (n = 14). Arrows indicate start of treatment. (H) Survival of mice bearing Yummer1.7 melanomas; the mice were euthanized when the tumors reached a volume of 1000 mm3. The arrow indicates the last treatment. Statistical analysis by log-rank test. (I) qPCR analysis of Adgre1 (F4/80), Mrc1 (CD206) and Ifng expression in lysates of Yummer1.7 melanomas treated as indicated and analyzed at termination (between day 30 and day 42 after tumor challenge). Data indicate mean fold change values ± SEM over the reference sample (IgG) after normalization to the average of Hprt and Gapdh housekeeping genes. For qPCR, we analyzed tumors of the first six mice that reached the termination endpoint (1000 mm3) in the experiment shown in (G). IgG (n = 5 to 6) and α-CSF1R (n = 6). Each dot represents one tumor. Statistical analysis by Student’s t test. ****P < 0.0001; ***P < 0.001; **P < 0.01; *P < 0.05.