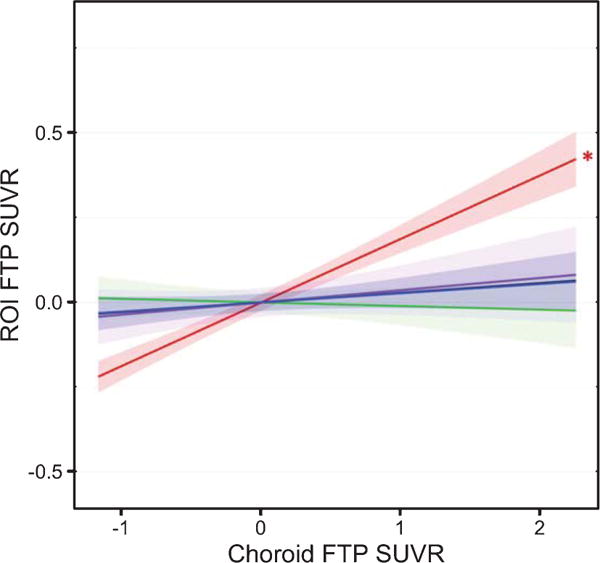
Fig. 3.

Regional FTP associations. Linear regressions models (covarying PiB DVR, age, sex, and education) across the combined race sample (N = 147) show the associations between CP FTP SUVR and FTP SUVR in the HC (red), AM (green), ER (violet), FF (black) and IT (blue), using GTM-corrected data. Shading represents 95% confidence intervals. The asterisk denotes the only significant association (p < 0.05), between the CP and HC FTP SUVR. Similar associations were observed between B/AA and W individuals (no significant interaction).
