Figure 5.

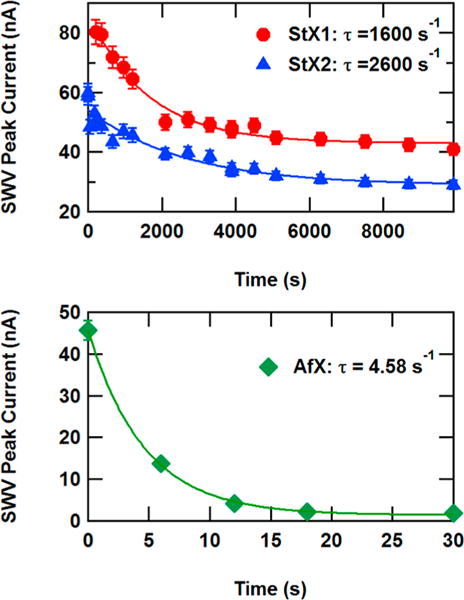
Square wave voltammetry (SWV) peak height vs time after ATP addition for DNA monolayers with 10 nM helicase binding and 2 mM adenosine triphosphate (ATP). Error bars represent uncertainty in the SWV peak current measurement.

Square wave voltammetry (SWV) peak height vs time after ATP addition for DNA monolayers with 10 nM helicase binding and 2 mM adenosine triphosphate (ATP). Error bars represent uncertainty in the SWV peak current measurement.