
Fig. 1.
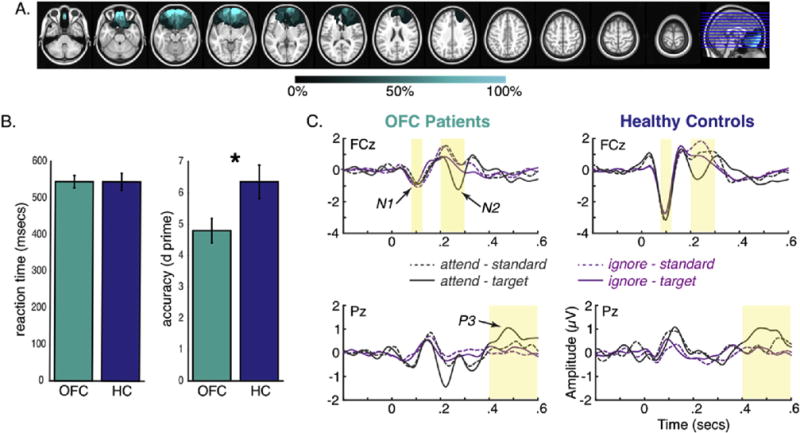
A) Lesion overlap for OFC patients. Each horizontal line on the far right image reflects the location of each slice shown on the left. Color map indicates percentage of overlap across patients. B) Behavioral performance for OFC patients (shown in teal) and healthy controls (shown in blue). OFC patients showed reduced d prime compared to healthy controls. C) ERP waveforms for OFC patients (left) and healthy controls (right) for electrodes FCz (top) and Pz (bottom). Time windows of analyses for N1 (.08–.12 sec), N2 (.2–.3 sec), and P3b (.4–.6 sec) are highlighted in yellow.