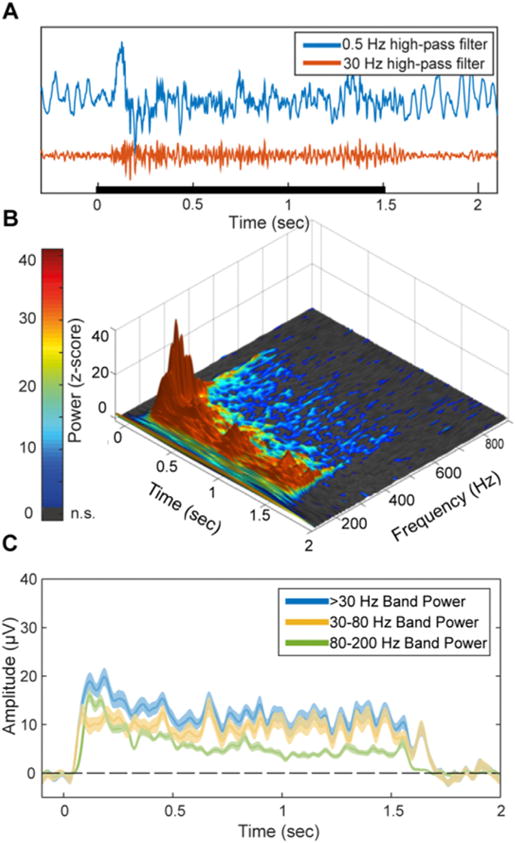
Fig. 2. Representative spectral response profile.

(A) The high-frequency response is evident in raw single trials. Blue and Red traces correspond to 0.5 Hz and 30 Hz high-pass filtered traces respectively of a single trial from an early visual cortex (V1/V2) electrode. Black bar indicates the stimulus duration. (B) Time-frequency response to 1500 ms visual stimuli averaged across both categories, in the same electrode. Z-axis and color scale represent z-score of the power at each time-frequency data point as normalized by the baseline for the same frequency band. Since both the baseline and response spectra are dominated by a 1/f power law in terms of mean power and variance, this normalization makes it possible to observe relative modulations in high-frequency bands which are otherwise too small in comparison to lower frequencies. Gray pixels represent non-significant z-score values (p < 0.05, uncorrected). Note that while the early response components contain higher power at high frequencies, the upper bound of significantly above-baseline activity is roughly fixed at 400–500 Hz throughout the activity time course, implying a general attenuation of the response over time rather than a narrowing of the response bandwidth. (C) Amplitude of band-limited activity in three frequency bands for the same electrode. Shading corresponds to standard error. While including lower frequencies increases the response SNR, all subsets of the high-frequency range produce a qualitatively similar response pattern, suggesting that the underlying activity is indeed broadband.
