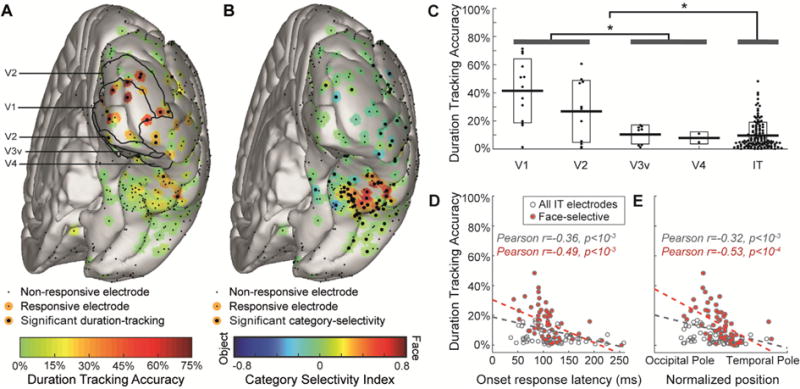
Fig. 3. Duration-tracking accuracy decreases gradually along the ventral visual stream.

(A) Duration-tracking accuracy for all subjects’ electrodes projected onto a common brain template. Visually responsive electrodes are surrounded by a color patch representing duration-tracking accuracy. Significant duration-tracking (FDR corrected, q = 0.05) is denoted by a thicker black dot. Anatomical regions marked with black contour lines within EVC are based on surface registration to a probabilistic atlas (Wang et al., 2014). (B) Same as (A), but for category selectivity index. Negative values (blue) correspond to object-preference. (C) Relation between duration-tracking and hierarchical position along the ventral stream (EVC areas defined based on the probabilistic atlas). Each dot corresponds to a single electrode, with horizontal dispersion based on data point density. Boxes correspond to standard deviation. Asterisks mark significant difference (p < 0.05) between EVC areas and IT and between V1/V2 and V3v/V4. Note that V3v/V4 sites are not necessarily earlier than all IT sites in terms of response latency. (D) duration-tracking within IT plotted against onset response latency, as a proxy for hierarchical position along the ventral stream. Face selective electrodes are marked red. (E) Same as (D), with hierarchical position measured as the electrode’s coordinate along the occipital-temporal axis.
