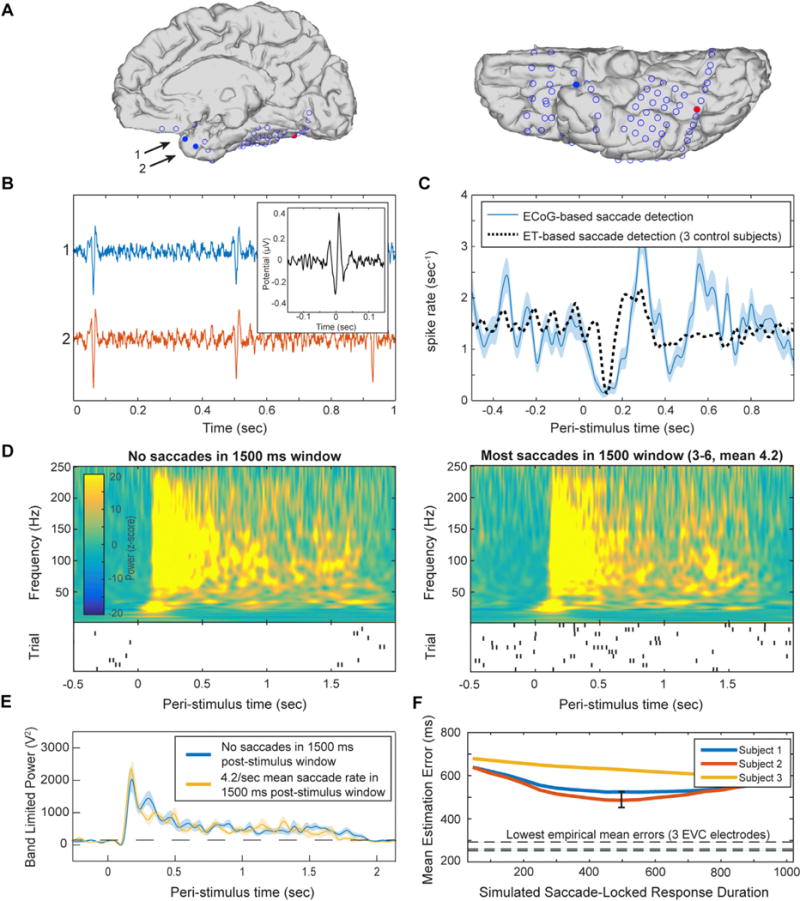
Fig. 8. No effect of saccades on sustained visual activity.

Saccadic events were identified in a single subject based on detection of saccadic spike potentials in two electrodes near the temporal pole. (A) Anatomical location of electrodes used to detect saccadic spikes (blue filled circles), and an electrode in the same subject exhibiting face-selective duration-tracking (red). (B) Representative un-averaged traces (>30 Hz high-pass-filtered) of spike events in the two temporal-pole electrodes. Inset: the averaged saccadic spike model from the 3 EEG control subjects which served as a model and in which saccade onsets were detected by eye tracking. (C) Peri-stimulus saccade rate. The ECoG-based saccades follow a typical post-stimulus suppression and rebound (blue), comparable to saccades detected using eye-tracking for the same task in control subjects (black dotted). (D) Average time-frequency plots of the responses to 1500 ms face stimuli in the posterior IT electrode showing face-selective duration-tracking, for trials with no saccades during stimulus presentation (left), vs. trials with many saccades (right). Shown below each time frequency plot is a raster plot of saccade events during each trial included in the group. Each row represents a single trial and each tick mark represents a detected saccade. (E) Direct comparison of high-frequency band-limited power for the two groups of trials. Cluster-based permutation testing did not detect differences in power at any time point. Dotted line marks mean baseline power. (F) Mean error for stimulus duration estimation from simulated HFB power constructed based on individual saccades, as function of the simulated duration of the saccade evoked activity. Each line represents simulation based on saccades from one of three EEG subjects. The lowest mean error achieved in the simulation was 485 ms, which is larger than that of 15 of the most strongly duration-dependent intracranial electrodes in the early visual cortex. The black error bar indicates 95% confidence interval across trials for the best-performing (lowest error) simulation (the three lowest errors from intracranial electrodes are shown as horizontal broken lines). We conclude that it is unlikely that the robust duration-tracking responses in early visual cortex were the result of summed transient responses driven by eye movements, regardless of the duration of these saccade-related bursts.
