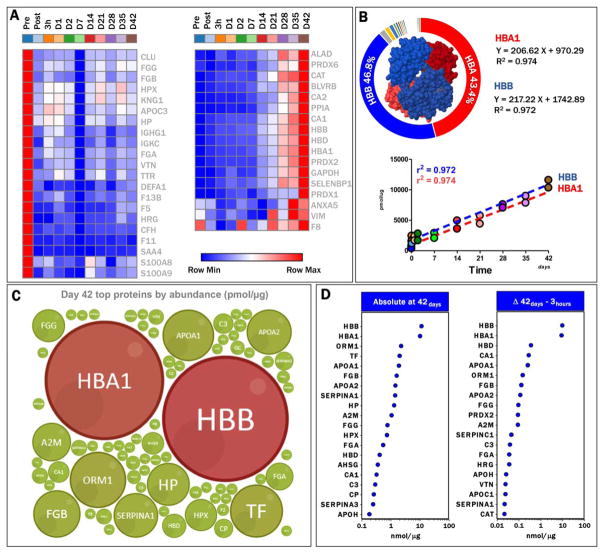
Fig. 2.
Quantitation of proteins in RBC supernatants. (A) Heat maps show protein removed by leukoreduction (red to blue, left panel) or increasing during storage in AS-3 RBC supernatants (blue to red, right panel). (B) Hbα1 and β (HBA1 and HBB) represent the 43.4 and 46.8% of the total proteins in RBC supernatants upon depletion of top two plasma proteins during sample preparation. Linearity of HBA1 and HBB increases in RBC supernatants during storage durations are indicated through quadratic correlation coefficients and first-degree equations. (C) Bubble plot representation of the relative abundance of Hb with relation to the top 50 proteins, as determined through this targeted analysis. (D) Absolute quantitative values (nmol/μg protein) are shown for the top 20 proteins in RBC supernatants at the end of the storage period (left panel). Delta increases, as determined by subtracting Day 1 absolute abundances from Day 42 values for each protein, are shown for the top 20 proteins increasing their levels during storage duration (right panel). Further details for all the 114 proteins are shown in Table S2. A color version of the figure can be found in the online version of the paper.

