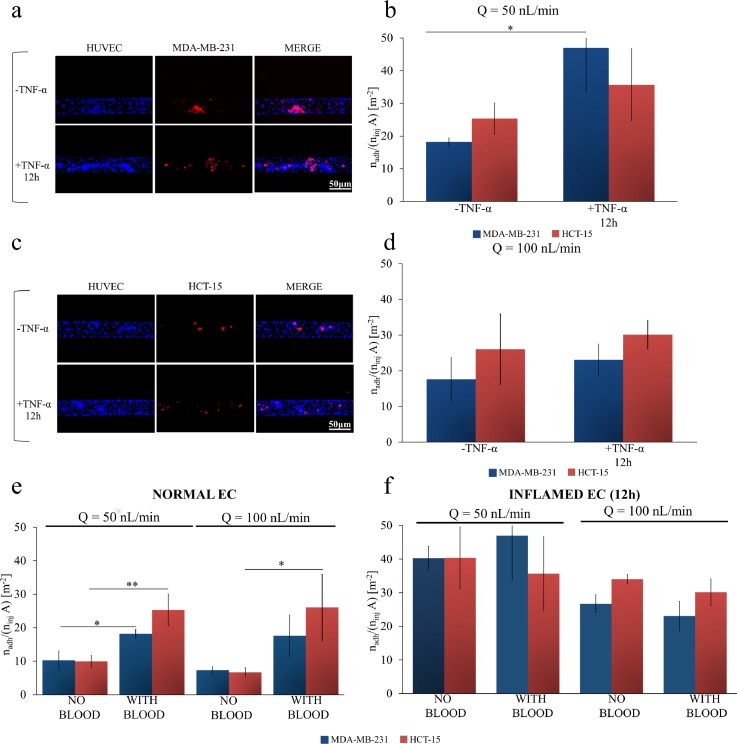
FIG. 4.
Cancer cell adhesion on inflamed endothelial cells under whole blood flow. (a) Representative fluorescence microscopy images of breast cancer cells MDA-MB-231 (cell membrane labeled in red with CM-DIL) flowing in whole blood and interacting, in a single-channel microfluidic chip, with a confluent monolayer of HUVECs (cell nuclei stained in blue with DAPI). (b) Normalized number of adhering cancer cells on a HUVEC monolayer of colon cancer HCT-15 (red column) and breast cancer cells MDA-MB-231 (blue column) at a flow rate (50 nl/min), with and without stimulation with TNF-α (25 ng/ml) in the presence of whole blood (hematocrit: 40%). (c) Representative fluorescence microscopy images of colon cancer cells HCT-15 (cell membrane labeled in red with CM-DIL) flowing in whole blood interacting, in a single-channel microfluidic chip, with a confluent monolayer of HUVECs (cell nuclei stained in blue with DAPI). (d) Normalized number of adhering cancer cells on a HUVEC monolayer of colon cancer cells HCT-15 (red column) and breast cancer cells MDA-MB-231 (blue column) at high flow rate (100 nl/min), with and without stimulation with TNF-α (25 ng/ml) in the presence of whole blood (hematocrit: 40%). (e) and (f) Normalized number of adhering colon cancer cells HCT-15 (red column) and breast cancer cells MDA-MB-231 (blue column) on a HUVEC monolayer, without (f) and with (e) stimulation of TNF-α (25 ng/ml) for 12 h at a flow rate of 50 nl/min and 100 nl/min, with and without whole blood (hematocrit: 40%) [Data are plotted as mean SD. n = 3. Statistical analysis ANOVA: * symbol denotes statistically significant difference p < 0.05; ** symbol denotes statistically significant difference p < 0.01 (ninj = 106 cells and A = 1.22 × 10⁻⁶ m2)].

