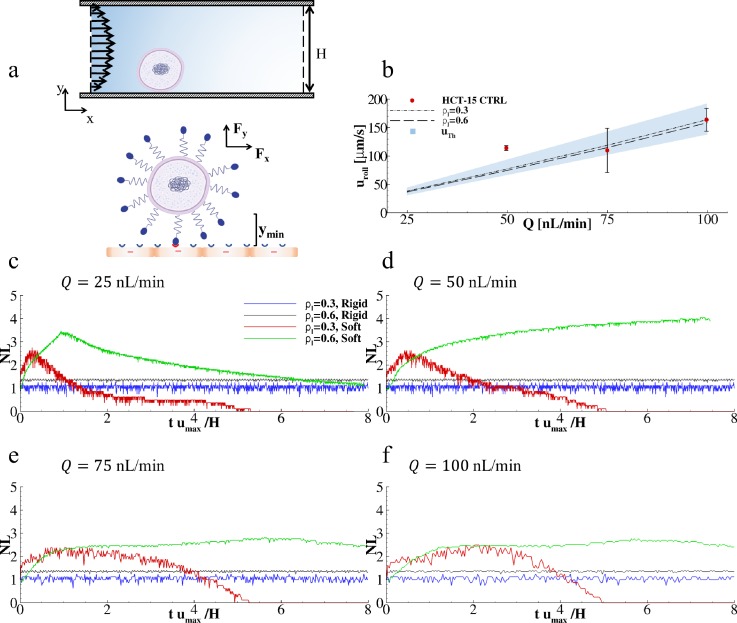
FIG. 5.
Predicting cancer cell adhesion and rolling on inflamed endothelial cells. (a) Schematic diagram presenting the computational problem with a close-up depicting ligand-receptor interactions at the interface between cancer (up) and endothelial (lower) cells. (b) Rolling velocities of cancer cells under four different flow rates (Q = 25, 50, 75, and 100 nl/min) and two ligand-receptor bond concentrations ( = 0.3 and 0.6) (Solid lines are simulated values, dots are experimental values, and dashed lines are theoretical values). (c)–(f) Variation of the number of active ligand-receptor bonds over time, under four different flow rates (Q = 25, 50, 75, and 100 nl/min), two ligand-receptor bond concentrations ( = 0.3 and 0.6), and for soft and rigid cancer cells. Nl is the number of closed bonds in each time step. This number is computed as the ratio between the current number of closed bonds over the number of closed bonds in the initial configuration.

