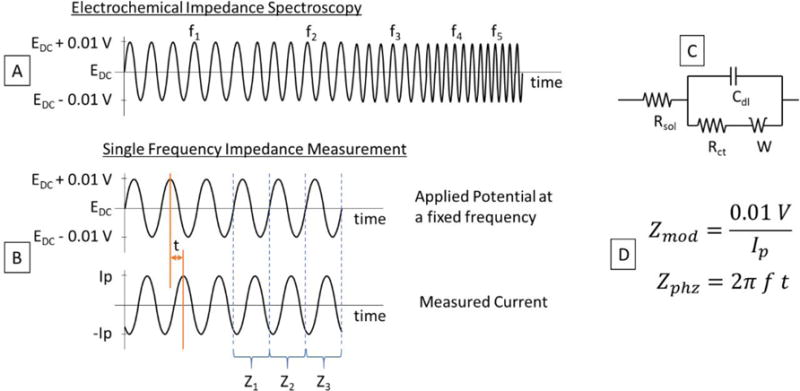
Figure 1.

Diagram of the voltage signals used for (A) Electrochemical Impedance Spectroscopy and (B) Single Frequency Impedance Measurement. These experiments provide information to obtain (C) the model circuit used and each parameter needed for the calculation of the electrochemical impedance using the equations in (D).
