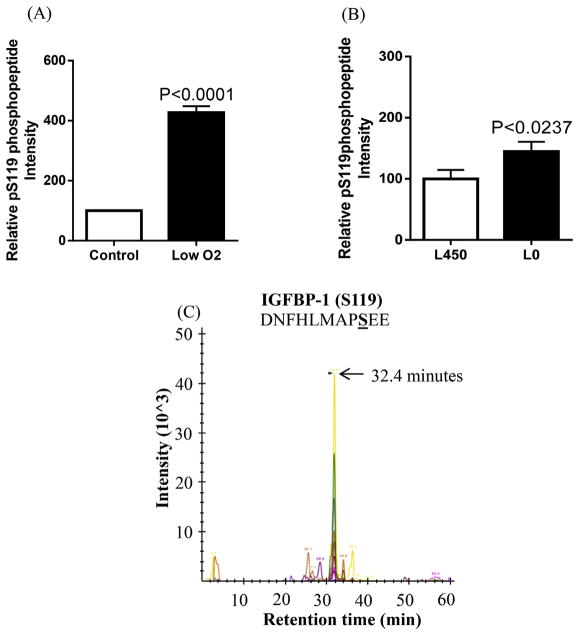
Fig. 3. MRM/MS analysis of IGFBP-1 phosphorylation at Ser119.
Phosphorylation of IGFBP-1 at Ser119 was enhanced in response to low oxygen tension (A) compared to normoxia and/or leucine deprivation (Leu 0 μM) vs control (Leu 450 μM) (B) in decidualized HIESC cell media. The data is a representative of pooled triplicates from two separate biological treatments. Depiction of the extracted ion chromatographs showing the transitions used to validate the phosphorylation at pS119 (C) (AB SCIEX QTRAP 4000 linear ion trap mass spectrometer).

