Fig. 1.

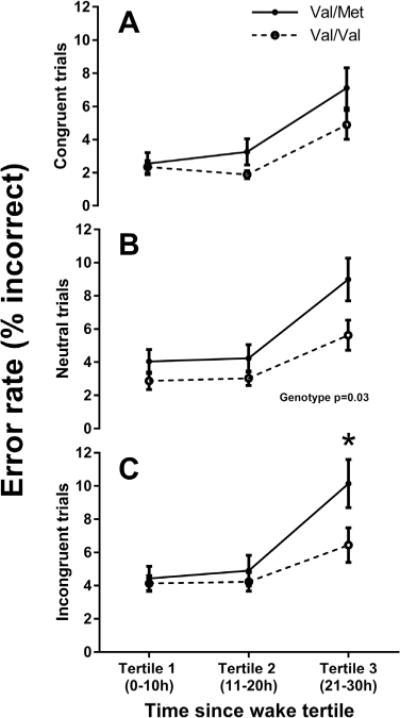
Mean and standard error of the number of errors committed for each genotype. Each trial type is plotted separately: (A) Congruent (B) Neutral, and (C) Incongruent. *p < 0.05. Untransformed data are plotted.

Mean and standard error of the number of errors committed for each genotype. Each trial type is plotted separately: (A) Congruent (B) Neutral, and (C) Incongruent. *p < 0.05. Untransformed data are plotted.