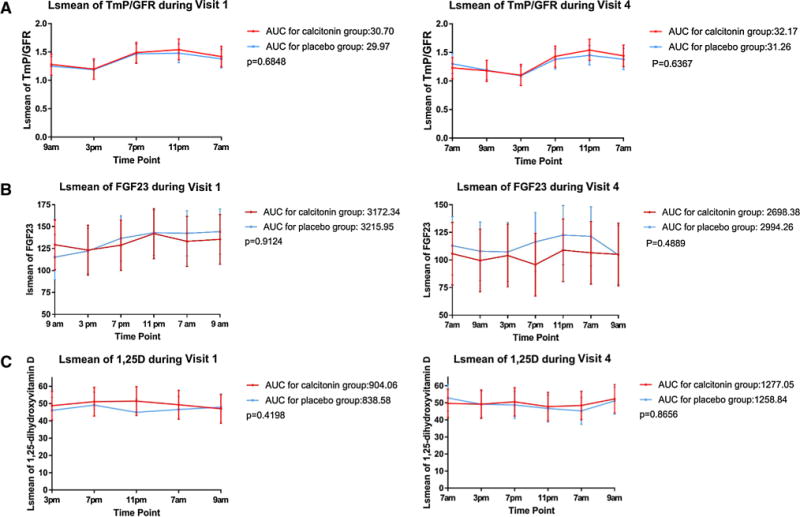
Fig. 1.

A Area under curve for TmP/GFR during Visit 1 (left panel) and Visit 4, for patients treated with nasal calcitonin (red line) or placebo nasal spray (blue line). B Area under the curve for FGF23 during Visit 1 (left panel) or Visit 4 (right panel), for patients treated with nasal calcitonin (red line) or placebo nasal spray (blue line). C Area under the curve for 1,25 dihydroxyvitamin D during Visit 1 (left panel) or Visit 4 (right panel) for patients treated with nasal calcitonin (red line) or placebo (blue line). In all panels, data are presented as area under the curve for Least-Squares Means. (Color figure online)
