
Figure 4. UGDH knockdown decreases GAG abundance and cell migration.
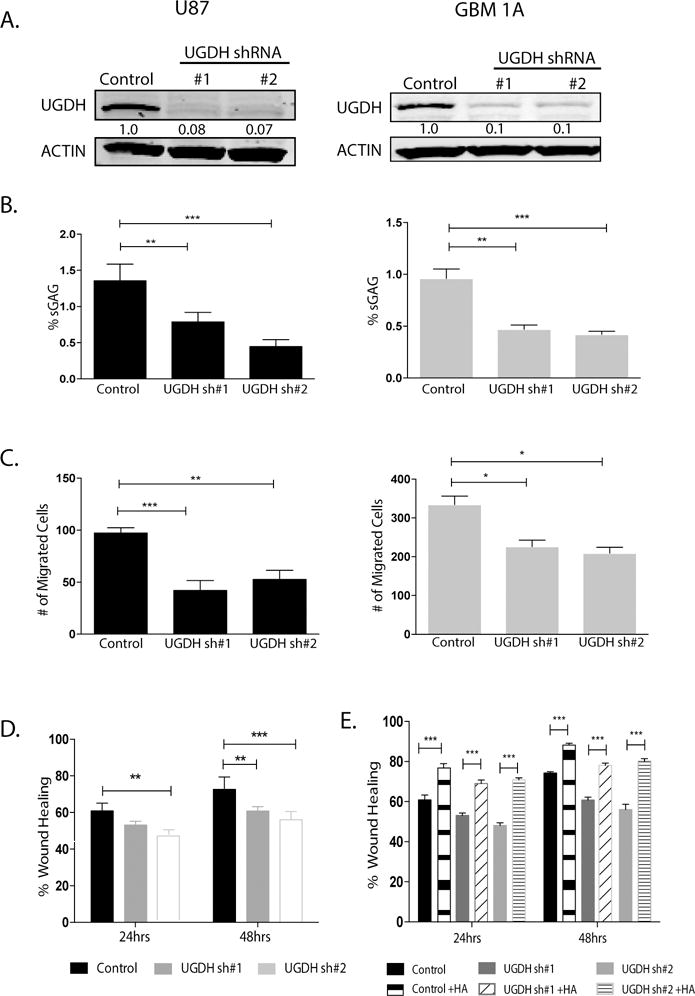
(A) U87 and HSR-GBM1A (GBM1A) cells were transduced with lentivirus coding for nonsilencing shRNA (Control), UGDH shRNA #1 or UGDH shRNA #2. UGDH knockdown was quantified by immunoblot analysis. Both UGDH shRNAs decreased UGDH protein level by more than 80%. (B) Sulfated GAG (sGAG) concentration was quantified by DMMB assay. UGDH knockdown showed significant reduction in GAG concentration in both U87 (Left panel) and GBM1A cells (right panel). (C) Transwell migration assays showed significant decrease in migration of UGDH knockdown U87 cells (left panel) and GBM1A cells (right panel). (D) Wound healing scratch assays showed UGDH knockdown decreased migration in U87 cells. (E). Exogenous HA rescued cell migration in scratch assays, in both U87 control and UGDH shRNA transduced cells.