Fig. 5.
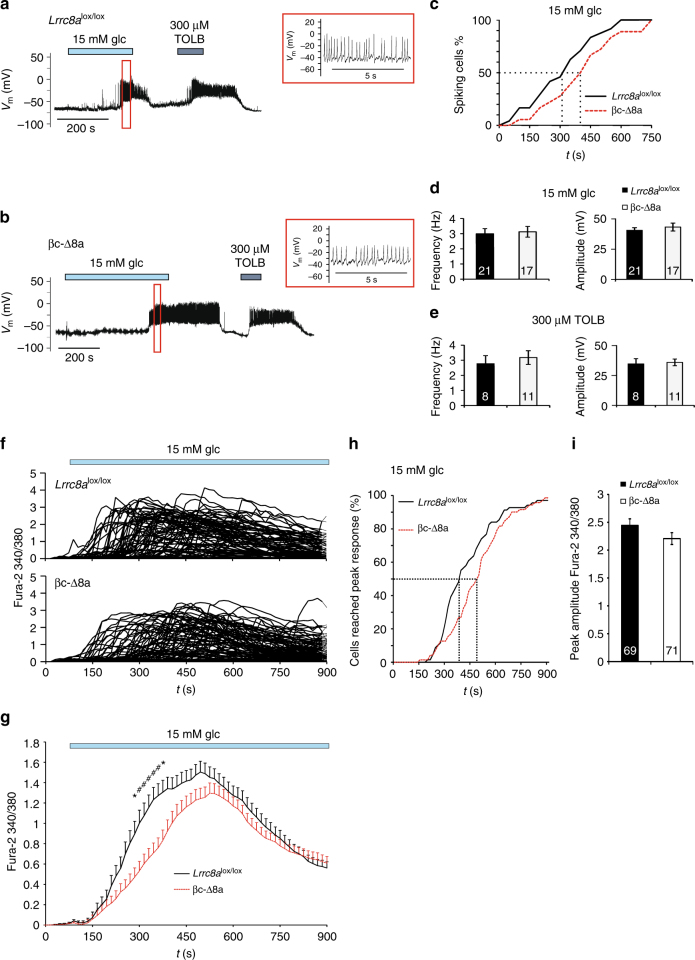
Glucose-induced electrical activity and intracellular Ca2+ response in Lrrc8alox/lox and βc-Δ8a cells. a, b Representative voltage traces for glucose- and tolbutamide-induced electrical activity of control Lrrc8alox/lox (a) and βc-Δ8a (b) β-cells obtained with gramicidin-perforated patches in the current clamp mode. Enlarged traces are shown in red boxes, with corresponding time periods indicated by boxes in the complete trace at left. c Percentage of electrically active cells plotted against time after glucose application. The response of βc-Δ8a cells seemed delayed by about 100 s (dotted lines), but the difference between genotypes failed to be statistically significant with 24 control and 18 βc-Δ8a β-cells. d Mean frequency and amplitude of spikes during bursts of action potentials elicited by 15 mM glucose. e Mean frequency and amplitude of spikes elicited by 300 µM tolbutamide. f Individual traces for Fura-2 fluorescence ratios elicited by excitation at λ = 340 and 380 nm (indicative of [Ca2+]i). 15 mM glucose was added at t = 60 s. g Mean ratio of Fura-2 fluorescence over time. Time points at which differences between the two genotypes reached statistical significance are indicated. *p < 0.05, #p < 0.01 (two-way ANOVA, Bonferroni multiple comparisons); mean values ± SEM, 69 control and 71 βc-Δ8a β-cells. h Cumulative plot of cells that have reached peak levels of [Ca2+]i after addition of 15 mM glucose as function of time. The difference is statistically significant (p = 0.005, Kolmogorov-Smirnov test). i Peak value of calcium response of β-cells of both genotypes. The difference is not significant. Number of cells indicated in columns

