Fig. 3.
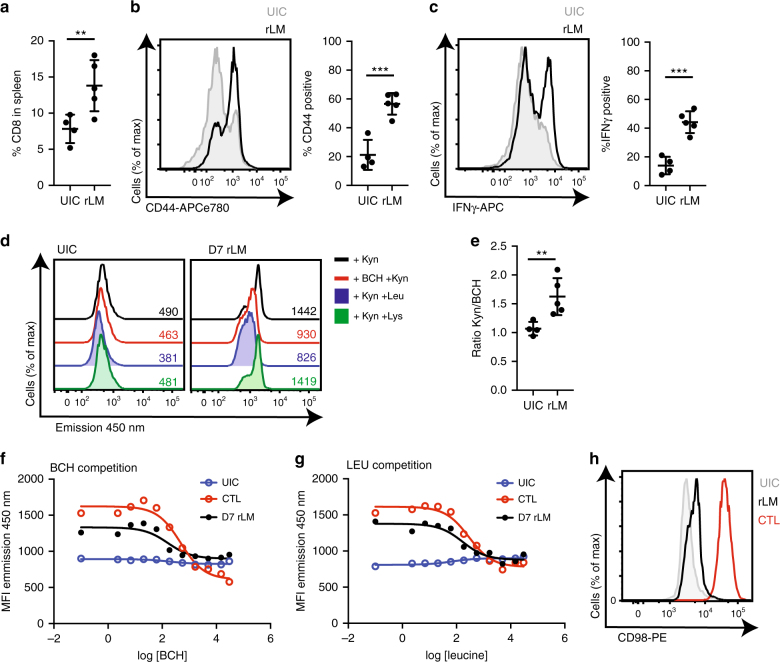
System L flow cytometry uptake assay with a mixed cell population. a Frequency of CD8+ T cells, b CD44 and c IFNγ expression in CD8+ T cells from spleen 7 days after recombinant Listeria monocytogenes (rLM) infection compared with uninfected controls (UIC). d 450 nm fluorescence emission of CD8+ T cells from uninfected controls (UIC; left) or D7 rLM (right) treated with kynurenine in the presence or absence of BCH (10 mM), Leu (5 mM) or Lys (5 mM) at (37 °C, 4 min). e Ratio of the 450 nm emission of CD8+ T cells treated with kynurenine ± BCH 10 mM (4 min, 37 °C). f, g Mean 450 nm fluorescence emission of CD8+ T cells from UIC, D7 rLM or CTL treated with kynurenine in the presence of increasing concentrations of BCH (f) or leucine (g) at (37 °C, 4 min). h CD98 surface expression of CD8+ T cells from UIC, D7 rLM or CTL. Error bars are ±s.d. from five biological replicates. Points indicate biological replicates (a–c, e). MFIs are indicated in the histograms (d), data are representative of five biological replicates (d, f–h). P values * = < 0.01; ** = < 0.005; *** = < 0.001; **** = < 0.0001 (unpaired t-test)

