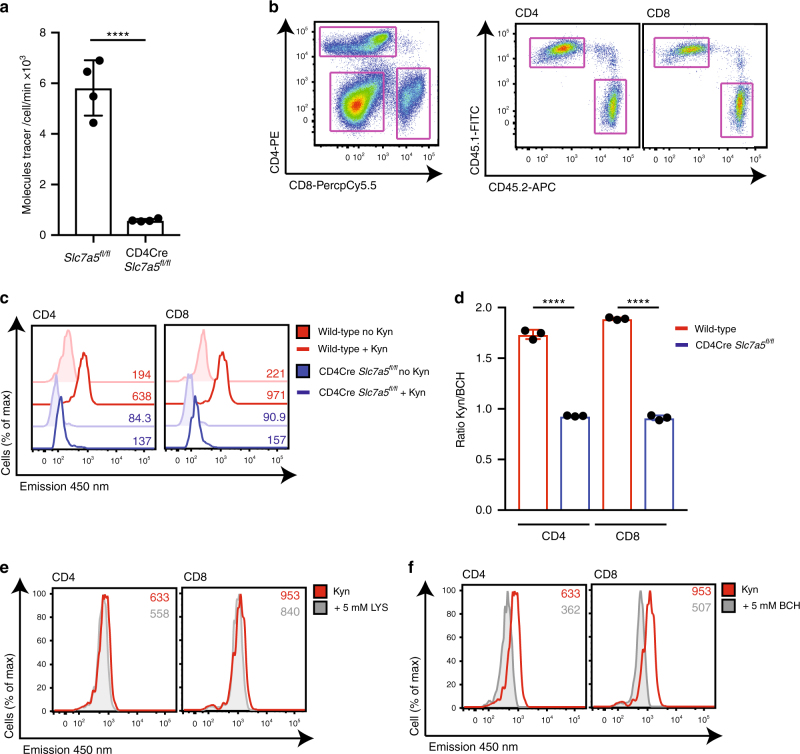
Fig. 4.
SLC7A5 mediates kynurenine transport in activated T cells. a Uptake of 3H-kynurenine in TCR-stimulated (CD3/CD28, 18 h) CD4+ T cells from Slc7a5fl/fl or CD4Cre+ Slc7a5fl/fl mice. b–d Wild-type (CD45.1) and CD4Cre+ Slc7a5fl/fl (CD45.2) splenocytes were mixed 1:1 and activated using CD3/CD28 antibodies for 24 h. b The data show representative flow cytometry profiles of the gating strategy used to identify CD4+, CD8+ (left panel) and subsequent CD45.1+ and CD45.2+ subpopulations (right panel). c The overlaid histograms show 450 nm emission in wild-type and CD4Cre+ Slc7a5fl/fl CD4+ (left panel) or CD8+ (right panel) T cells after 4 min (37 °C) with or without kynurenine (200 μM). MFIs are indicated. d Ratio of the 450 nm emission of T cells treated with kynurenine ± BCH 10 mM. e, f Histograms showing 450 nm fluorescence emission of wild-type CD4+ (left panel) and CD8+ (right panel) T cells after 4 min kynurenine (200 μM, 37 °C) uptake in the presence or absence of 5 mM lysine, a System y + L competitor (e); or 5 mM BCH, a System L inhibitor (f). Error bars are ±s.d. Individual points indicate biological replicates. MFIs are indicated in the histograms, data are representative of four (a) or three (b–f) biological replicates. P values **** = < 0.0001 (unpaired t-test, a; ordinary one-way ANOVA, d)

