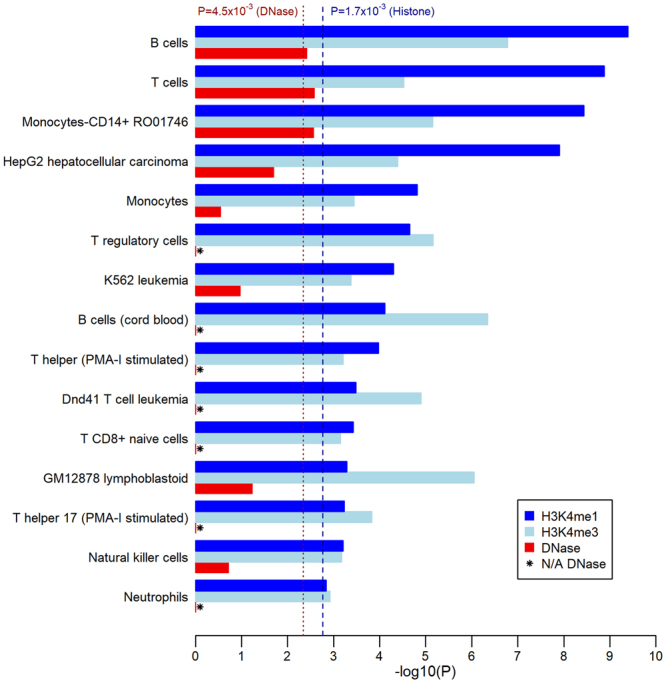
Figure 2.

Selection of histone modification and DNase peak enrichment analysis results. The enrichment analyses compared 106 SNPs in replicated 3-SNP haplotypes to nominally associated single SNPs in gene regions. Figure shows enrichment test p-values that are log-transformed (-log10(P)) for the 15 blood/liver cell types for which haplotype SNPs are significantly enriched for both H3K4me1 and H3K4me3 peaks. Dashed and dotted vertical lines show Bonferroni-corrected p-value thresholds based on the number of blood/liver cell types for which Roadpmap Epigenomics assay data was available (29 and 11 types for histone mark and DNase peaks, respectively).
