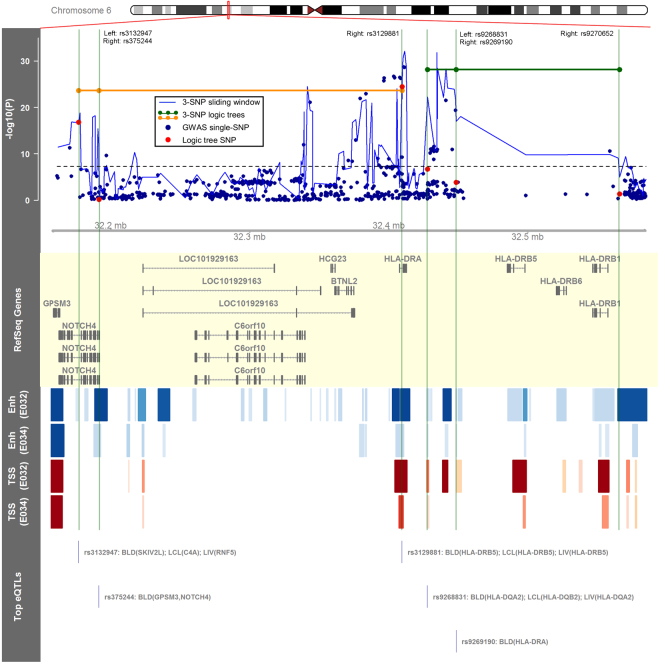
Figure 3.
Visualization of two replicated 3-SNP haplotype logic trees containing SNPs in the HLA region. The plotted region spans chr6:32156782–32585905 (hg19), which corresponds with the red rectangle in the chromosomal ideogram. The top data track shows single-SNP association results and haplotype association results using benchmark (“3-SNP sliding window”) and proposed (“3-SNP logic tree”) methods for the selected genomic region. The subsequent annotation tracks show RefSeq genes, a heatmap corresponding to Roadmap Epigenomics21 H3K4me1 (Enh) and H3K4me3 (TSS) ChIP-seq peaks in primary B cells (E032) and primary T cells (E034), and the top significant blood (BLD), lymphoblastoid (LCL), and liver (LIV) eQTLs (expression quantitative trait loci) associated with SNPs in replicated haplotypes (GTEx Consortium)20.

