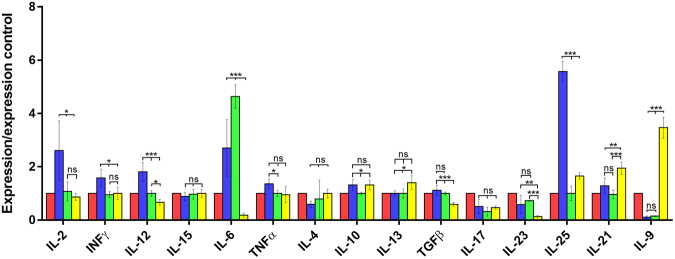
Figure 2.
Expression levels of cytokines in MSN determined by quantitative real time PCR after normalization with β-actin, and standardization against control animals. Red bar, C (uninfected and untreated control group); Blue bar, C-IF (infected control group); Green bar, AB-IF (animal treated with IL-23mAB and infected with A. tetraptera group); Yellow bar, AB-C (treated with IL-23mAB and uninfected group). The values are the means of the normalized expression values ± SEM. Tukey Test, p < 0.001 (***) and p < 0.05 (*).

