Figure 7.
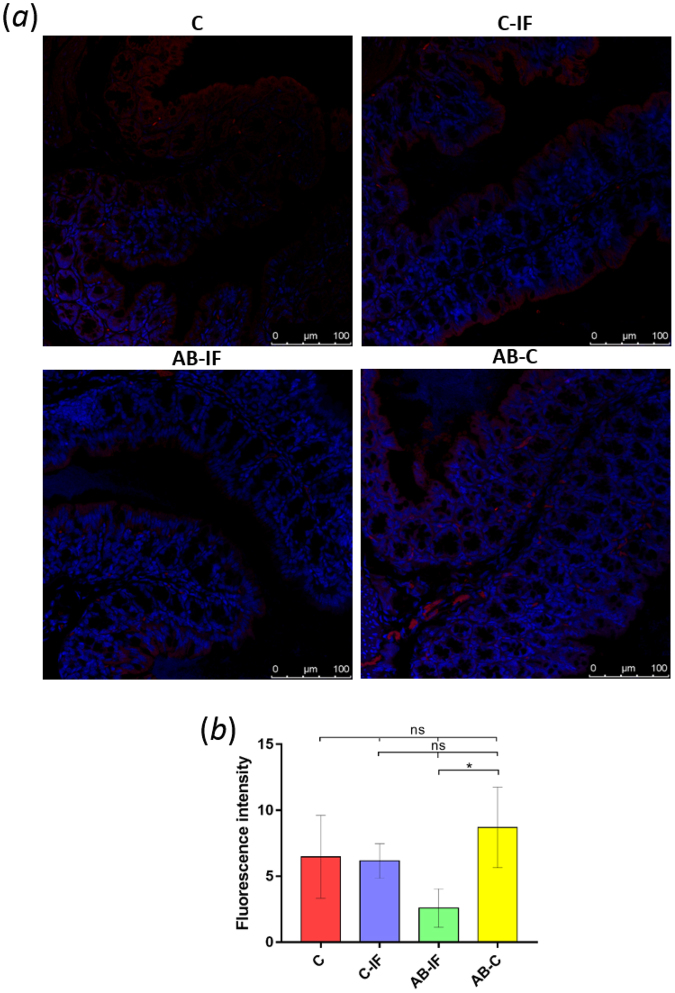
Immunofluorescence location and quantification of CCL17 by confocal microscopy in the colon sections of mice used in the experiments. C (uninfected and untreated control group); C-IF (infected control group); AB-IF (treated with IL-23mAB and infected group); AB-C (treated with IL-23mAB and uninfected group). (a) Semi-thin intestinal sections showing red (Alexa Fluor® 594) signal for the labelled anti-CCL17 antibody. The cell nuclei were stained with DAPI (blue). (b) Measure of fluorescence intensity for CCL17 in four areas of 100 µm2, mean ± SEM. The values are the means of the normalized expression values ± SEM. Tukey Test, p < 0.001 (***) and p < 0.05 (*).

