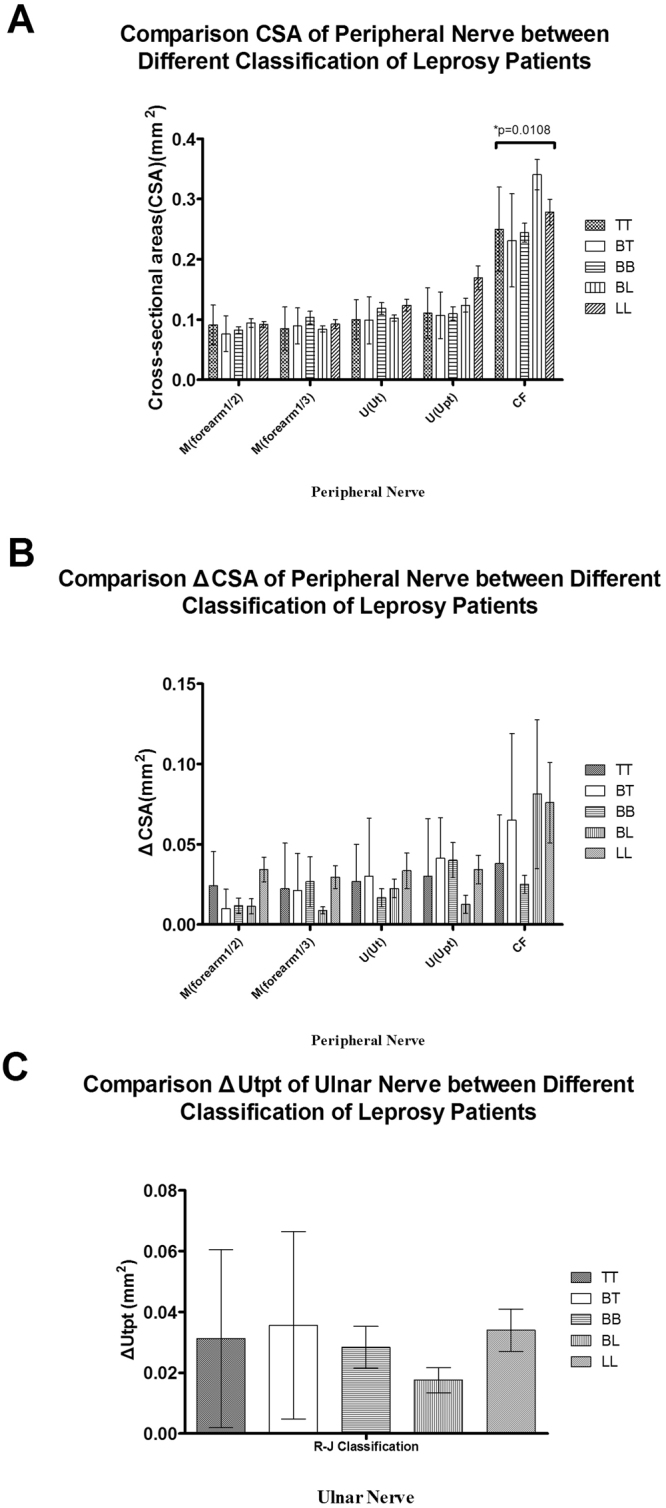
Figure 6.

CSA, ΔCSA and ΔUtpt results. The patients were classified according to the Ridley-Jopling classifications. (A) CSAs results of the leprosy patients who were classified according to the Ridley-Jopling classifications; (B) ΔCSA results of the leprosy patients who were classified according to the Ridley-Jopling classifications; and (C) ΔUtpt results of the leprosy patients who were classified according to the Ridley-Jopling classifications. The nonparametric Mann-Whitney U test was used to analyze differences between two groups. The Kruskal-Wallis test was used to analyze differences among three groups. All the statistical analyses were performed using Prism version 5 (GraphPad Software Inc., San Diego, CA, USA). Two-sided p-values < 0.05 were considered statistically significant. *p < 0.05 indicates a significant difference.
