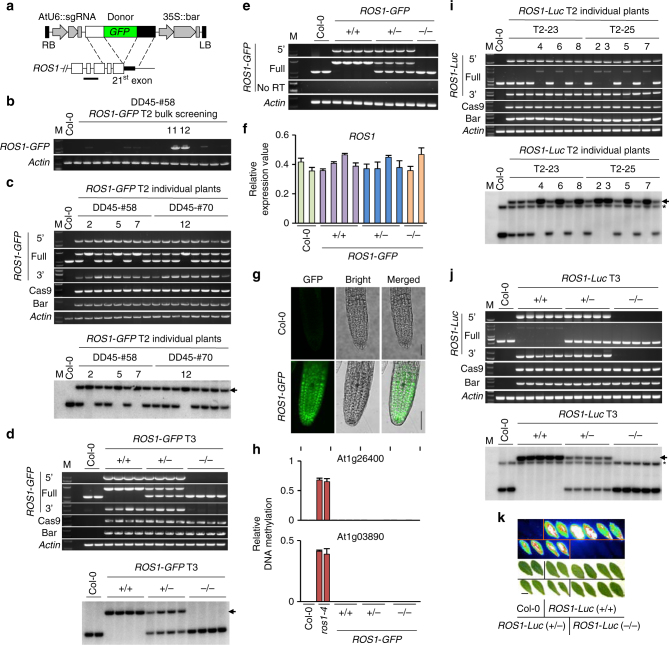
Fig. 2.
GFP integration into the endogenous ROS1 locus by gene targeting. a Schematics showing HDR donor transgene construct (top) and part of the targeted ROS1 locus (bottom). The horizontal line indicates the position of a probe for Southern blot hybridization. b PCR screening of T2 bulk samples (see Supplementary Figure 2). Primers for the 5′ part of ROS1-GFP were used (see Supplementary Figure 2). c, d Genotyping PCR and Southern blotting of a subset of individual T2 (c) and T3 plants (d) of ROS1-GFP, respectively. The eight plants in the DD45-#58 background were selected from populations 11 and 12 in (b). Arrow indicates the band of ROS1-GFP from gene targeting. e RT-PCR and f qRT-PCR on the same T3 plants as in (d). The error bars indicate P values of Student’s t test (n = 4). See Supplementary Figure 2. g Detection of GFP fluorescence. Scale bar, 50 µm. h qChop-PCR at the At1g26400 and At1g03890 loci. The ros1-4 mutant was used as a positive control. The error bars indicate P values of Student’s t test (n = 4). i, j Genotyping PCR and Southern blotting for individual T2 lines (i) and T3 plants (j) of ROS1-Luc, respectively. Arrow indicates the band of ROS1-Luc from gene targeting, and the asterisk denotes non-specific cross-hybridization band. k Luminescence in T3 ROS1-Luc leaves. Scale bar, 1 cm. All PCR primers are as depicted in Supplementary Figure 2b, c and Supplementary Table 4

