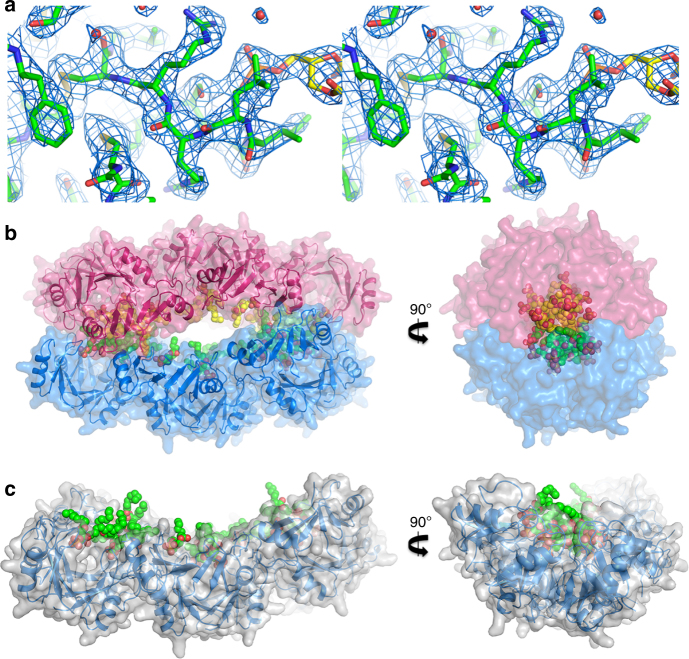
Fig. 3.
Crystal structure of the NaD1–PA complex. a Representative stereo view of the electron density maps for NaD1–PA structure. The 2Fo–Fc map is shown as a blue mesh contoured at 1.5σ. Protein carbon atoms are colored green while the PA carbon atoms are colored yellow. Oxygen is colored red, phosphorous orange, nitrogen blue, and sulfur yellow. b The 20-meric NaD1–PA complex (blue cartoon representation with gray transparent surface rendering) harboring 14 bound PA molecules (shown as spheres with carbon in green, oxygen in red, phosphorus in orange), as viewed from the front (left) and from the side (right). c Two 20-meric complexes in blue and pink cartoon/surface representation, with the PA molecules bound to the top or lower halves, indicated as green/red or yellow/red spheres, respectively. The front view (left) reveals the slight curvature of the complexes, while the side view (right) shows the hydrophobic core created from the acyl chains of bound PA facing inwards towards the center of the complex

